Metrics
Create reusable metrics, find their experiment runs, and report checkout events with SDKs and APIs.
Overview
A metric defines the behavior or numeric value you want to measure. Experiments reference these reusable definitions as a Primary metric or a Guardrail. Creating a definition does not start collecting events: your application must also report the matching metric key.
This tutorial creates two metrics for a checkout experiment:
| Name | Key | Type | Aggregation | Purpose |
|---|---|---|---|---|
| Checkout completed | checkout-completed | Binary conversion | Once per user | Measure whether an exposed user completes checkout. |
| Checkout errors | checkout-errors | Numeric value | Count all | Measure how many checkout errors an exposed user encounters. |
You need access to Metrics in a project environment. The screenshots use First Project / Dev. Keep the same environment when creating the feature flag, metrics, Layer, and experiment.
Create a conversion metric
- Confirm the project and environment in the page header, then open Metrics under Release Decision.
- Click New metric.
- Enter Name:
Checkout completedand Key:checkout-completed. The key is the event name your application will send. - Choose Type: Binary conversion. Aggregation is fixed to Once per user for this type.
- Enter Description:
Users who complete checkout. - Click Create metric.
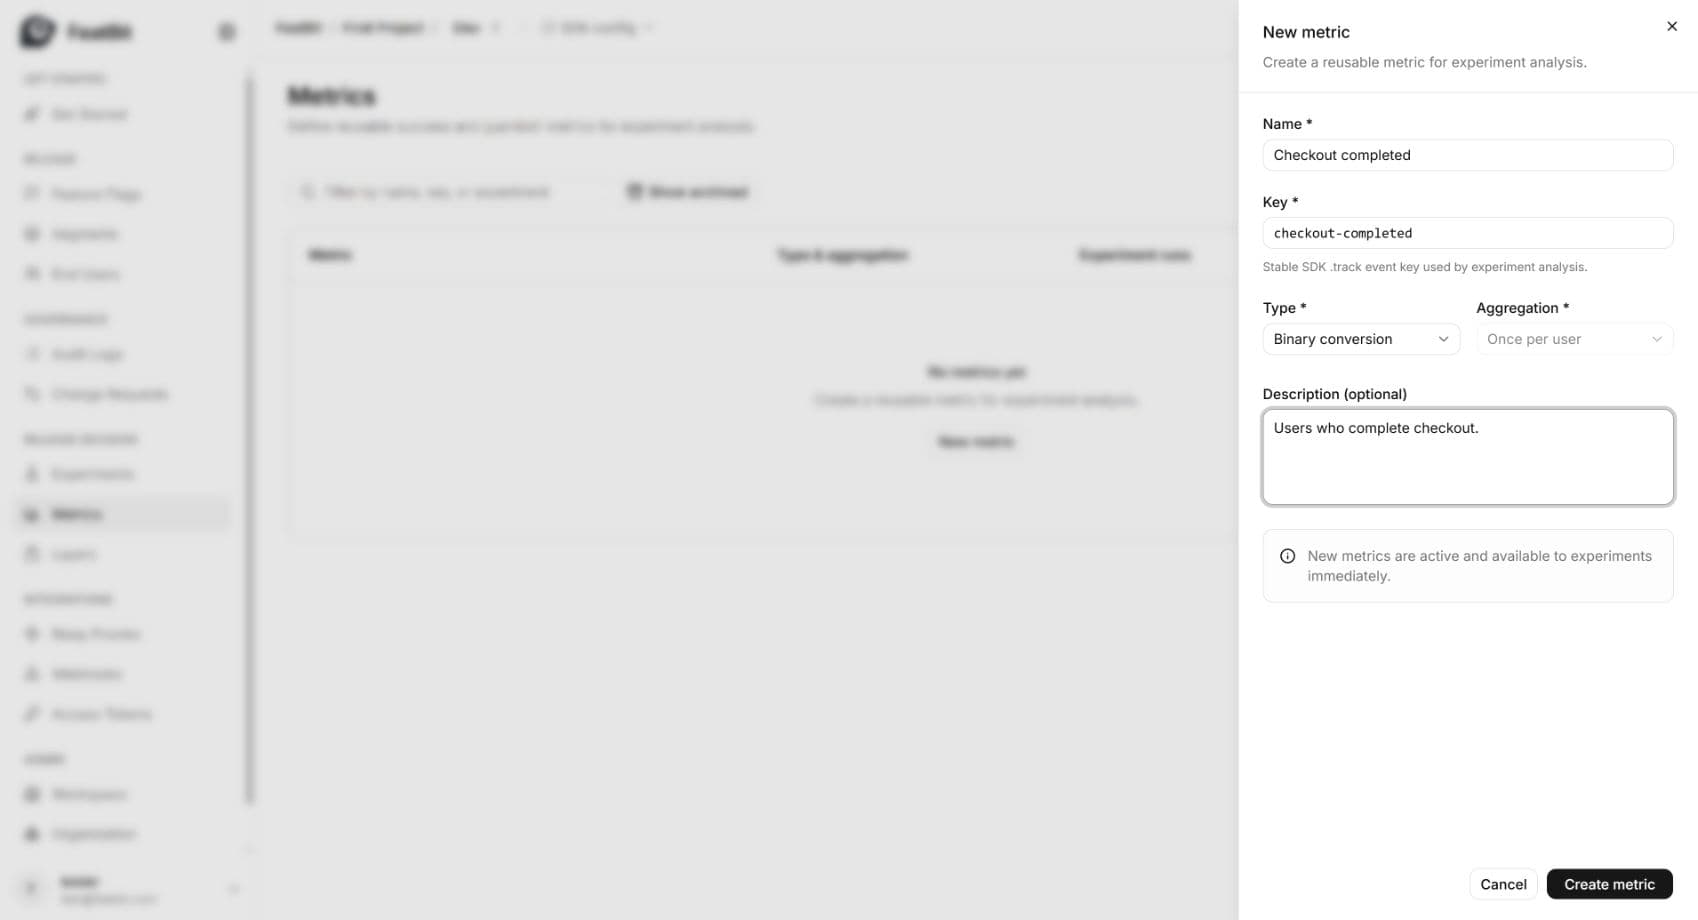
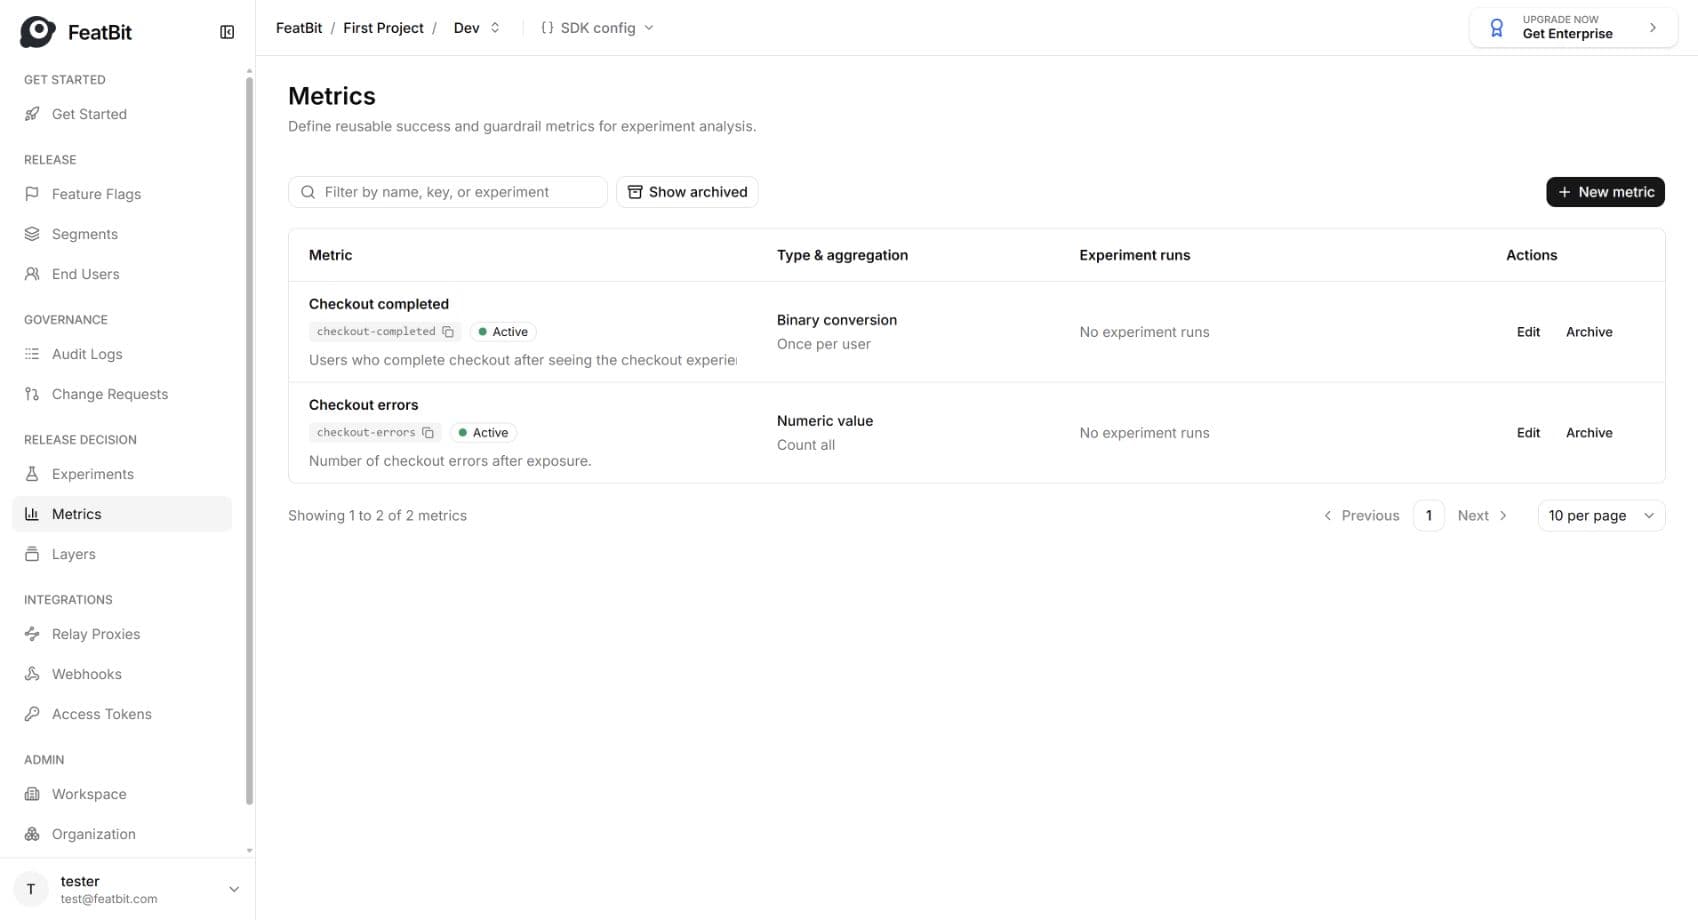
The new metric appears as Active in the list. Before an experiment references it, Experiment runs shows No experiment runs.
Edit and verify the definition
- Click Edit in the Checkout completed row.
- Confirm that the saved name, type, and aggregation are correct. The Key is read-only after creation.
- Change Description to
Users who complete checkout after seeing the checkout experience. - Click Save changes and wait for the editor to close.
- Refresh the page and reopen Edit. Confirm that the new description remains.
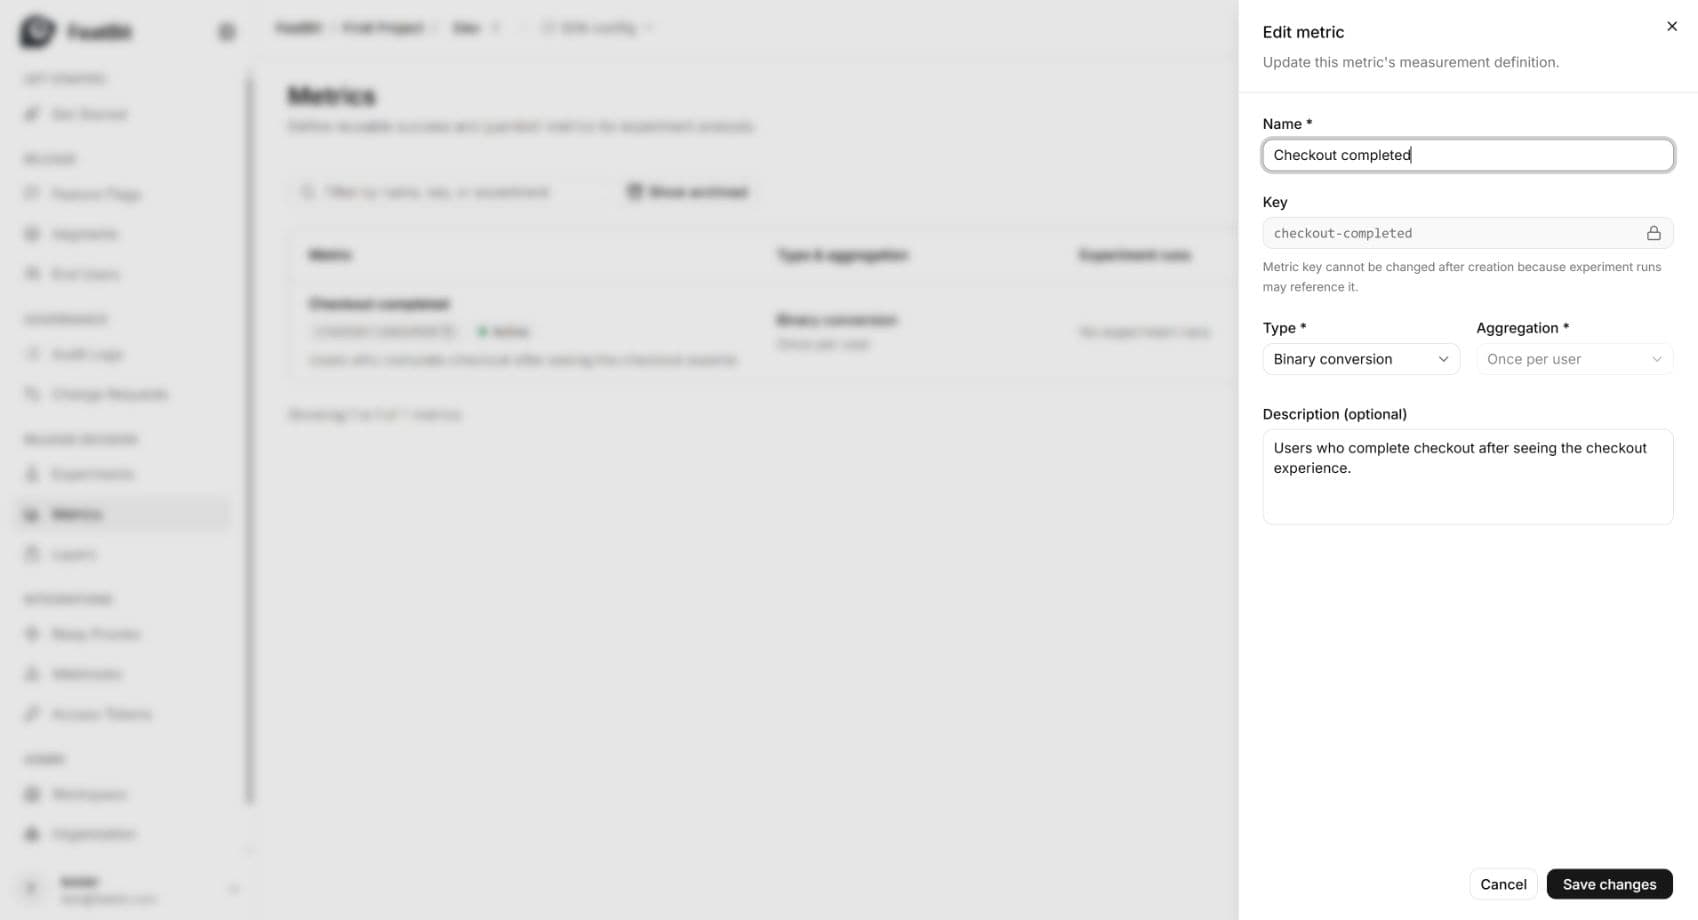
Use Cancel to close the editor without further changes. Keep an event key's meaning consistent while collecting experiment data.
Add the numeric guardrail
- Click New metric again.
- Enter Name:
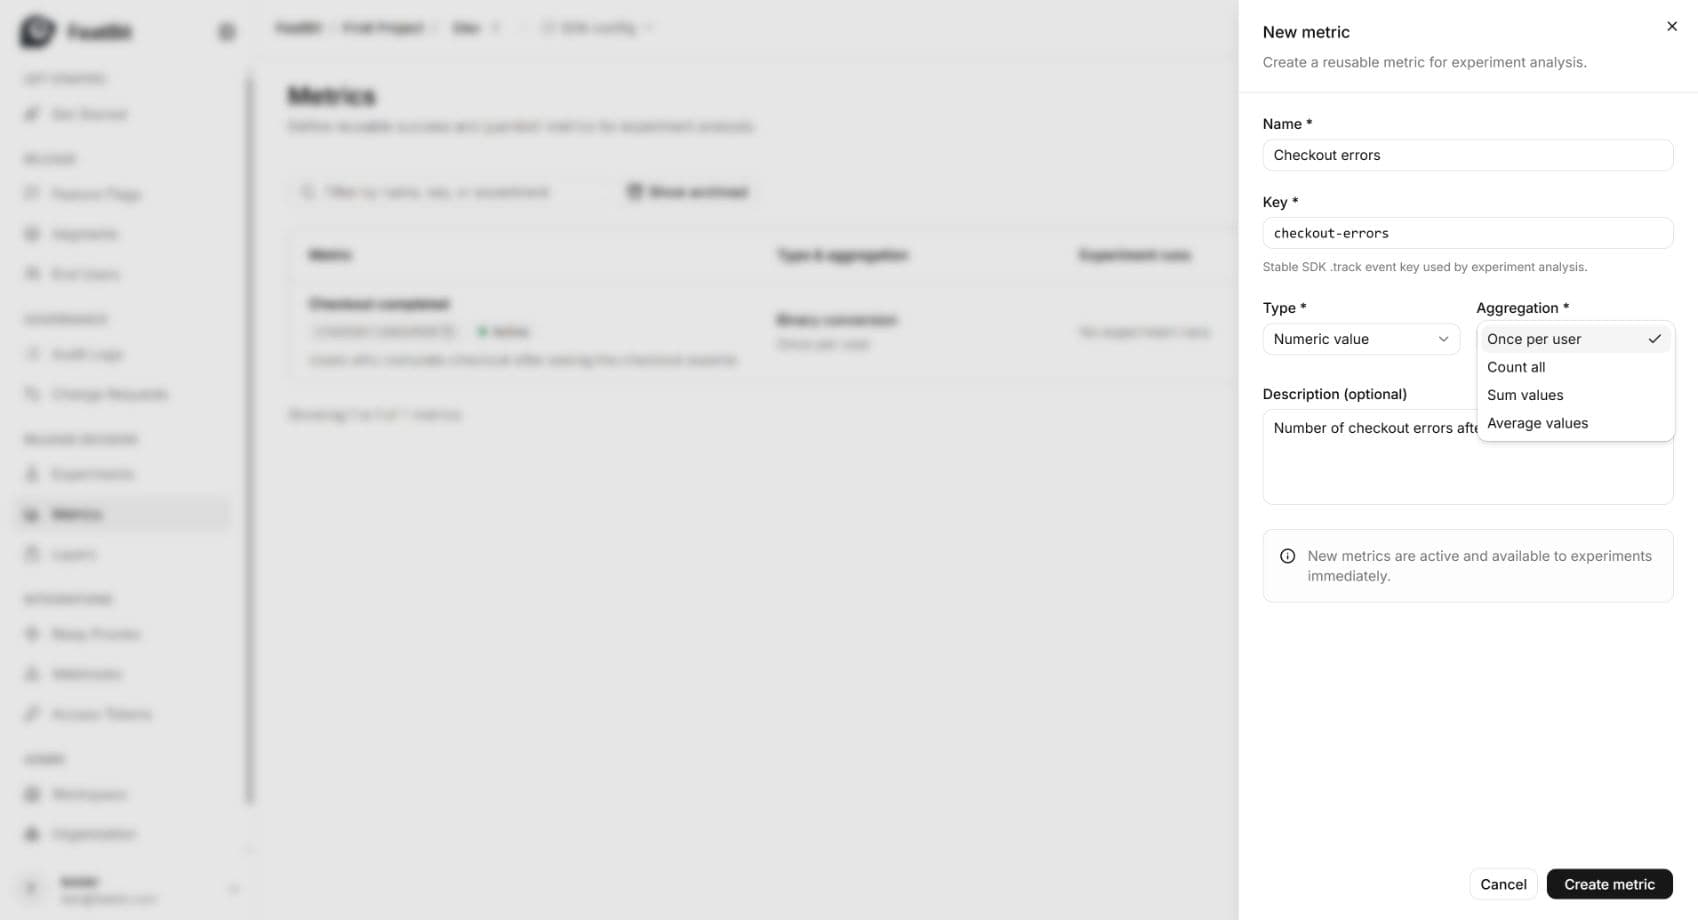
Checkout errorsand Key:checkout-errors. - Choose Type: Numeric value and Aggregation: Count all.
- Enter Description:
Number of checkout errors after exposure. - Click Create metric, then refresh the list to verify both definitions.
Numeric metrics expose the following aggregation choices:
Choose the right type and aggregation
Analysis first calculates each eligible exposed user's contribution, then compares the variants. An exposed user with no matching metric event contributes zero.
| Type | Supported aggregation | What one user contributes | Example |
|---|---|---|---|
| Binary conversion | Once per user only | 1 if at least one matching event occurred; otherwise 0. | Did the user complete checkout? |
| Numeric value | Once per user | 1 if at least one matching event occurred; otherwise 0. It does not take the first event's numeric value. | Did the user encounter any checkout error? |
| Numeric value | Count all | The number of matching events. | Three error events contribute 3. |
| Numeric value | Sum values | The sum of the events' numeric values. | Orders worth 10 and 20 contribute 30. |
| Numeric value | Average values | The mean of that user's event values. | Checkout durations of 10 and 20 seconds contribute 15 seconds. |
Average values gives each exposed user a contribution; it is not a pooled average of all events. For example, if one user reports values 10 and 20 and a second exposed user reports no events, their contributions are 15 and 0. The variant's mean is 7.5.
For Checkout errors, send one event for each actual error. Sending checkout-errors with a value of 0 still creates an event and therefore increases Count all. If no error occurred, do not send that error event.
Find metrics and their experiment runs
- In Metrics, use Filter by name, key, or experiment. Enter
checkout-errorsto find the guardrail by its key. - Clear the field to restore the list. You can also search by metric name, such as
Checkout completed. - Complete the metric binding and Run creation in Experiments.
- Return to Metrics and enter
Simplify checkoutin the filter. - Check Experiment runs: Checkout completed is Primary, Checkout errors is Guardrail, and both reference
run-1.
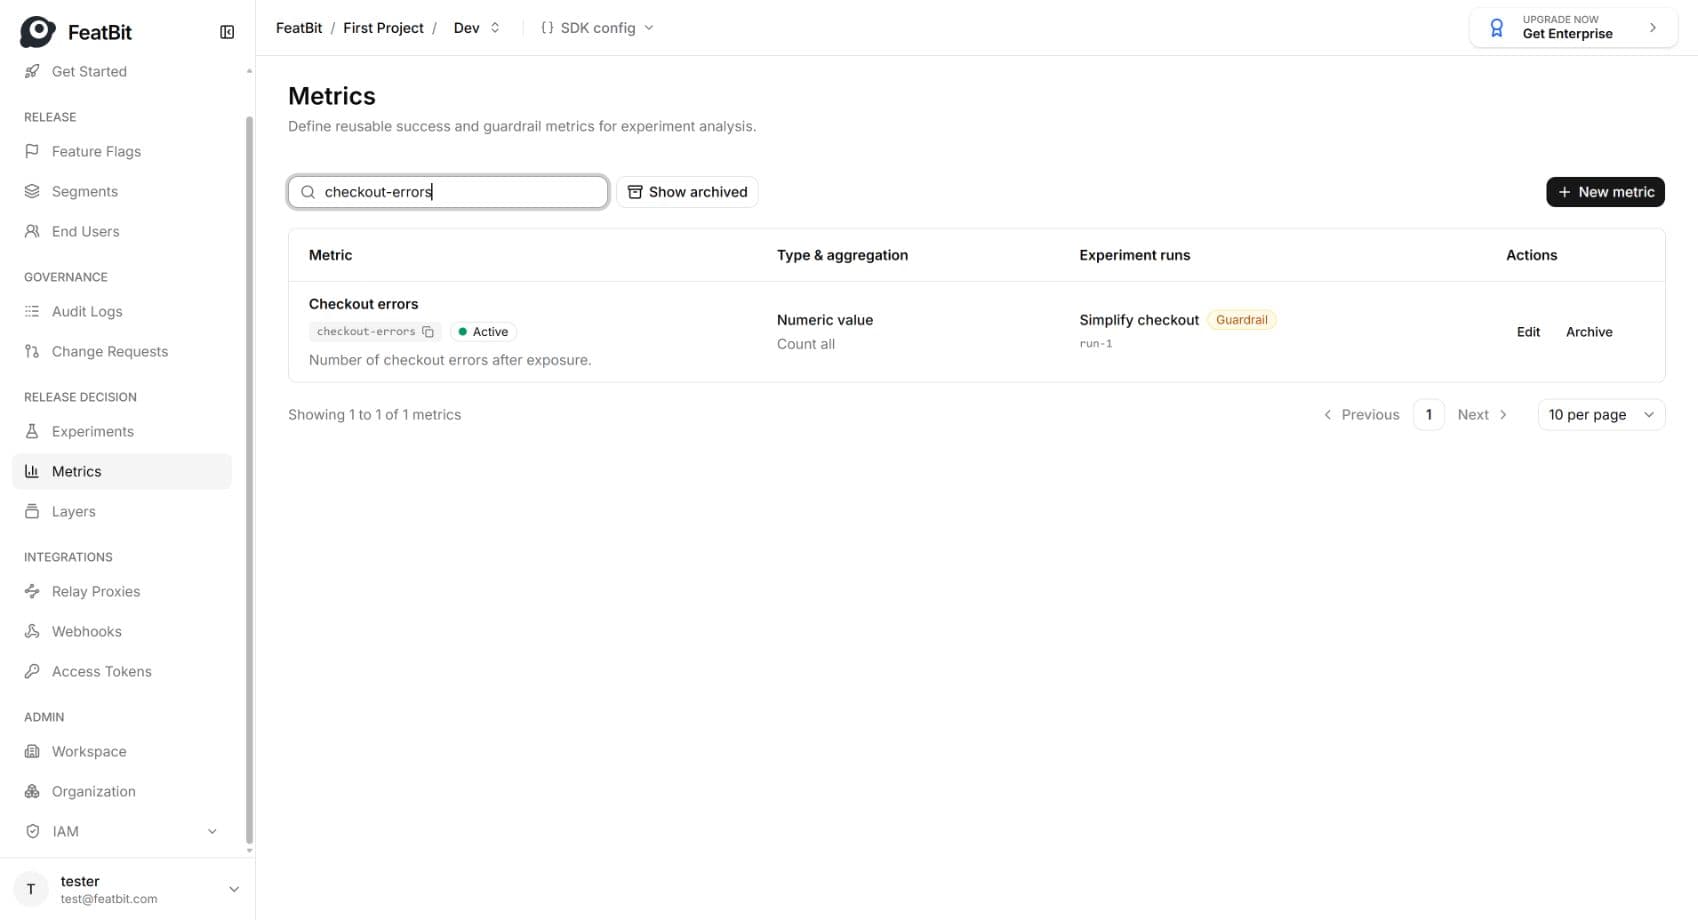
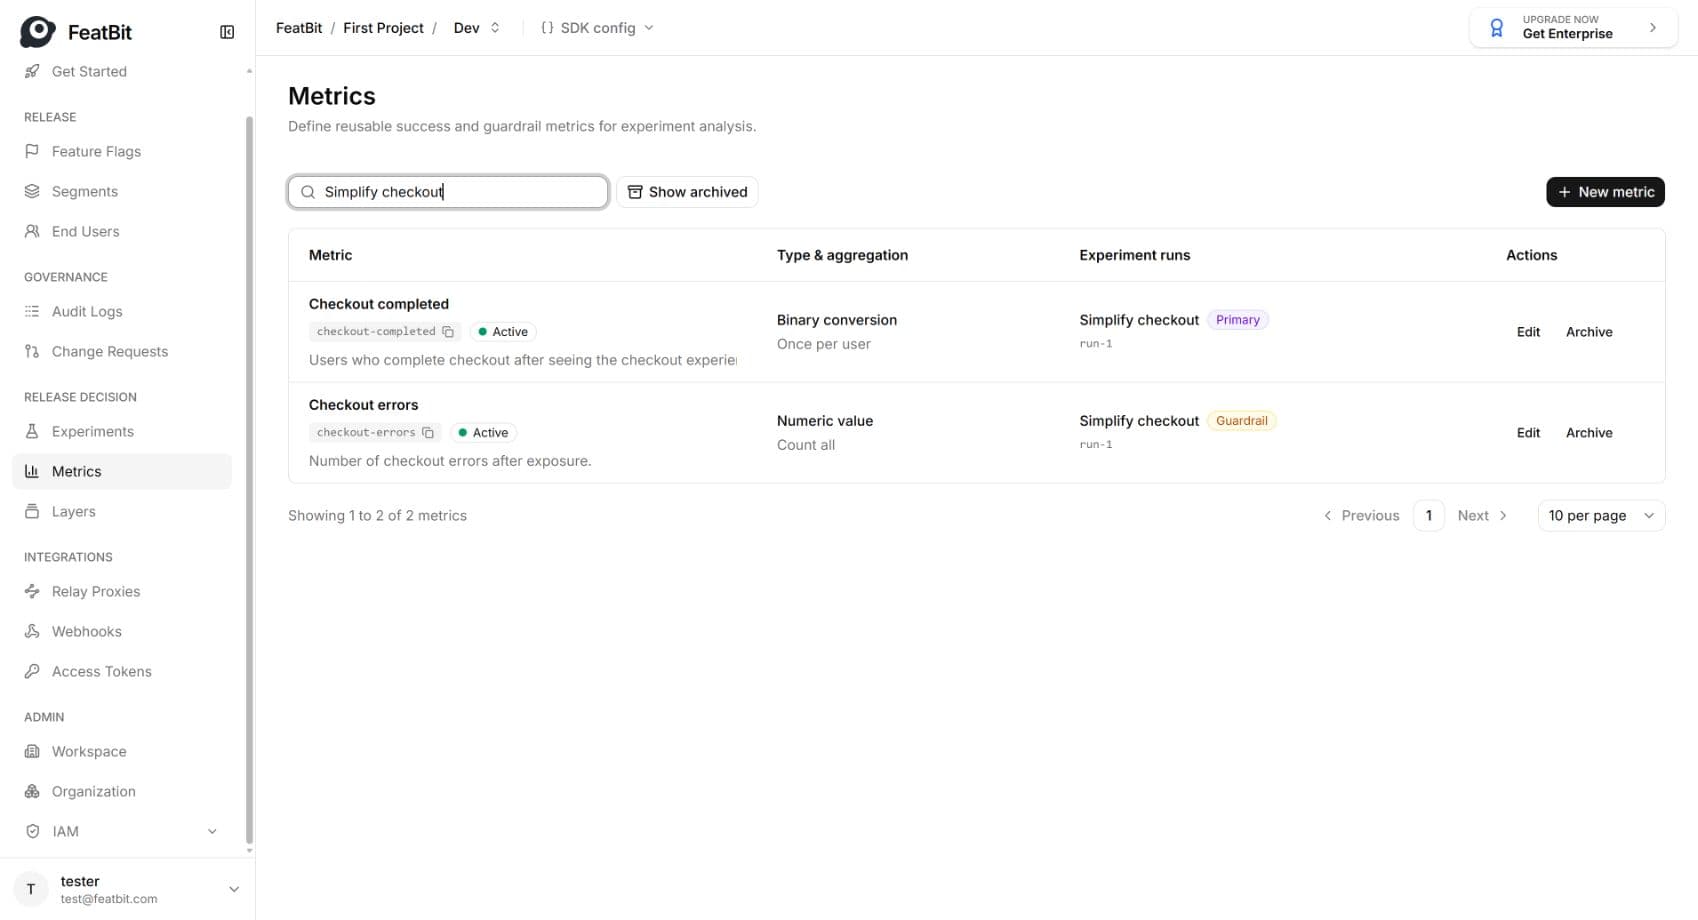
Associations appear after they have been saved in the experiment. A matching name alone does not establish a relationship.
Set direction in the experiment
The definition and its experiment bindings have different jobs:
| Setting | Where to edit it | Checkout example |
|---|---|---|
| Name, key, description, type, aggregation | Metrics | checkout-completed, Binary conversion, Once per user |
| Primary metric improvement direction | Experiment Exposure → Edit metrics → Direction | Higher is better for checkout completion |
| Guardrail warning direction | Experiment Exposure → Edit metrics → Alert if | Increases for checkout errors; the saved binding shows Increase is bad |
For a guardrail that should increase, Alert if → Decreases produces Decrease is bad. Choose the direction for that experiment; editing a shared metric definition is not how you change one experiment's direction.
Report metric events
All FeatBit SDKs can report metric events. You can also use APIs such as the Track Insights API to send events directly. See the SDK overview for the available SDKs.
Here is a .NET example using an initialized client. The orderCompleted and checkoutError conditions represent outcomes from your checkout flow.
var user = FbUser.Builder("customer-1234").Build();

// Evaluate the flag when the user enters checkout.
var simplifiedCheckout = client.BoolVariation("simplified-checkout", user, false);

// When the order is completed:
if (orderCompleted)
    client.Track(user, "checkout-completed");

// For each checkout error:
if (checkoutError)
    client.Track(user, "checkout-errors", 1.0);
Use the metric keys defined above, the same user ID and environment for evaluation and events, and timestamps within the Run's observation window. After events are processed, click Analyze latest data in the Run to see the results.
Next step
Create the Checkout experience Layer, then use these two metrics in the complete experiment walkthrough.