The flag insights
Overview
This topic explains how to use the flag evaluations graph on the Insights tab to observe flag performance over time.
The insights data is near real time and may have some delay, if you see no data, just wait a while then refresh the page
Using the flag evaluations graph
The flag evaluations graph gives your engineering and product teams insight into how many times users are receiving each variation of a flag over time.
To view a flag's evaluations graph:
- Navigate to the flags list.
- Click the name of the flag you want to view evaluations over time for. The flag's Insights tab appears.
- Click the Insights tab. The flag evaluations graph appears:
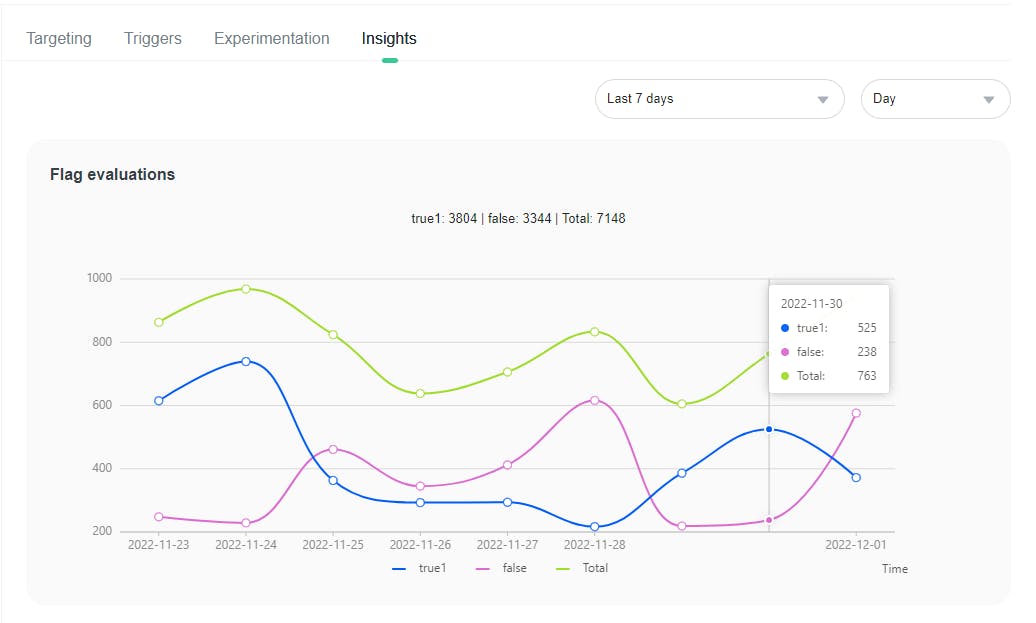
Flag evaluations graphs are generated on a per-flag evaluation basis, not a per-user basis. This means that if the same user is evaluated 20 times, the flag evaluations graph records and displays all 20 evaluations.
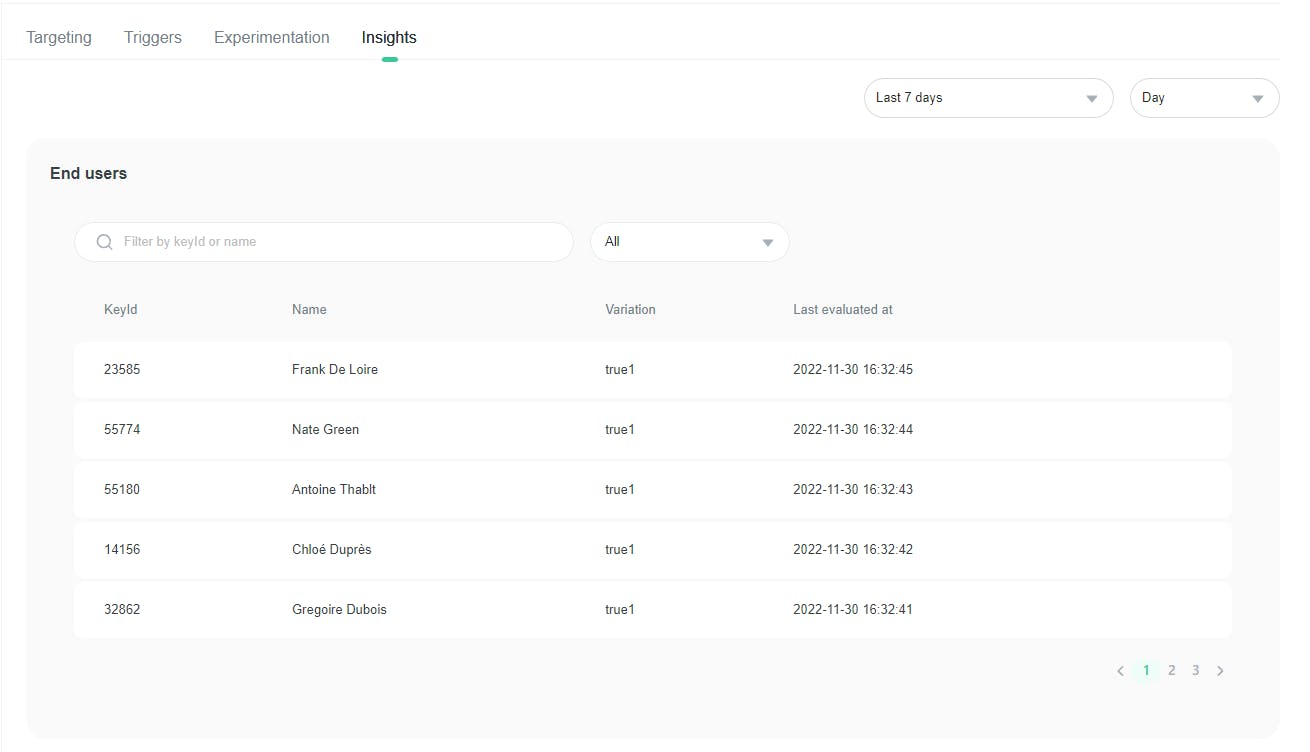
Using the end-user's flag variation table
Below the flag evaluation graph, there is an end-user's flag variation table that tells your team what variation an end-user has gotten over time.