Grafana
Overview
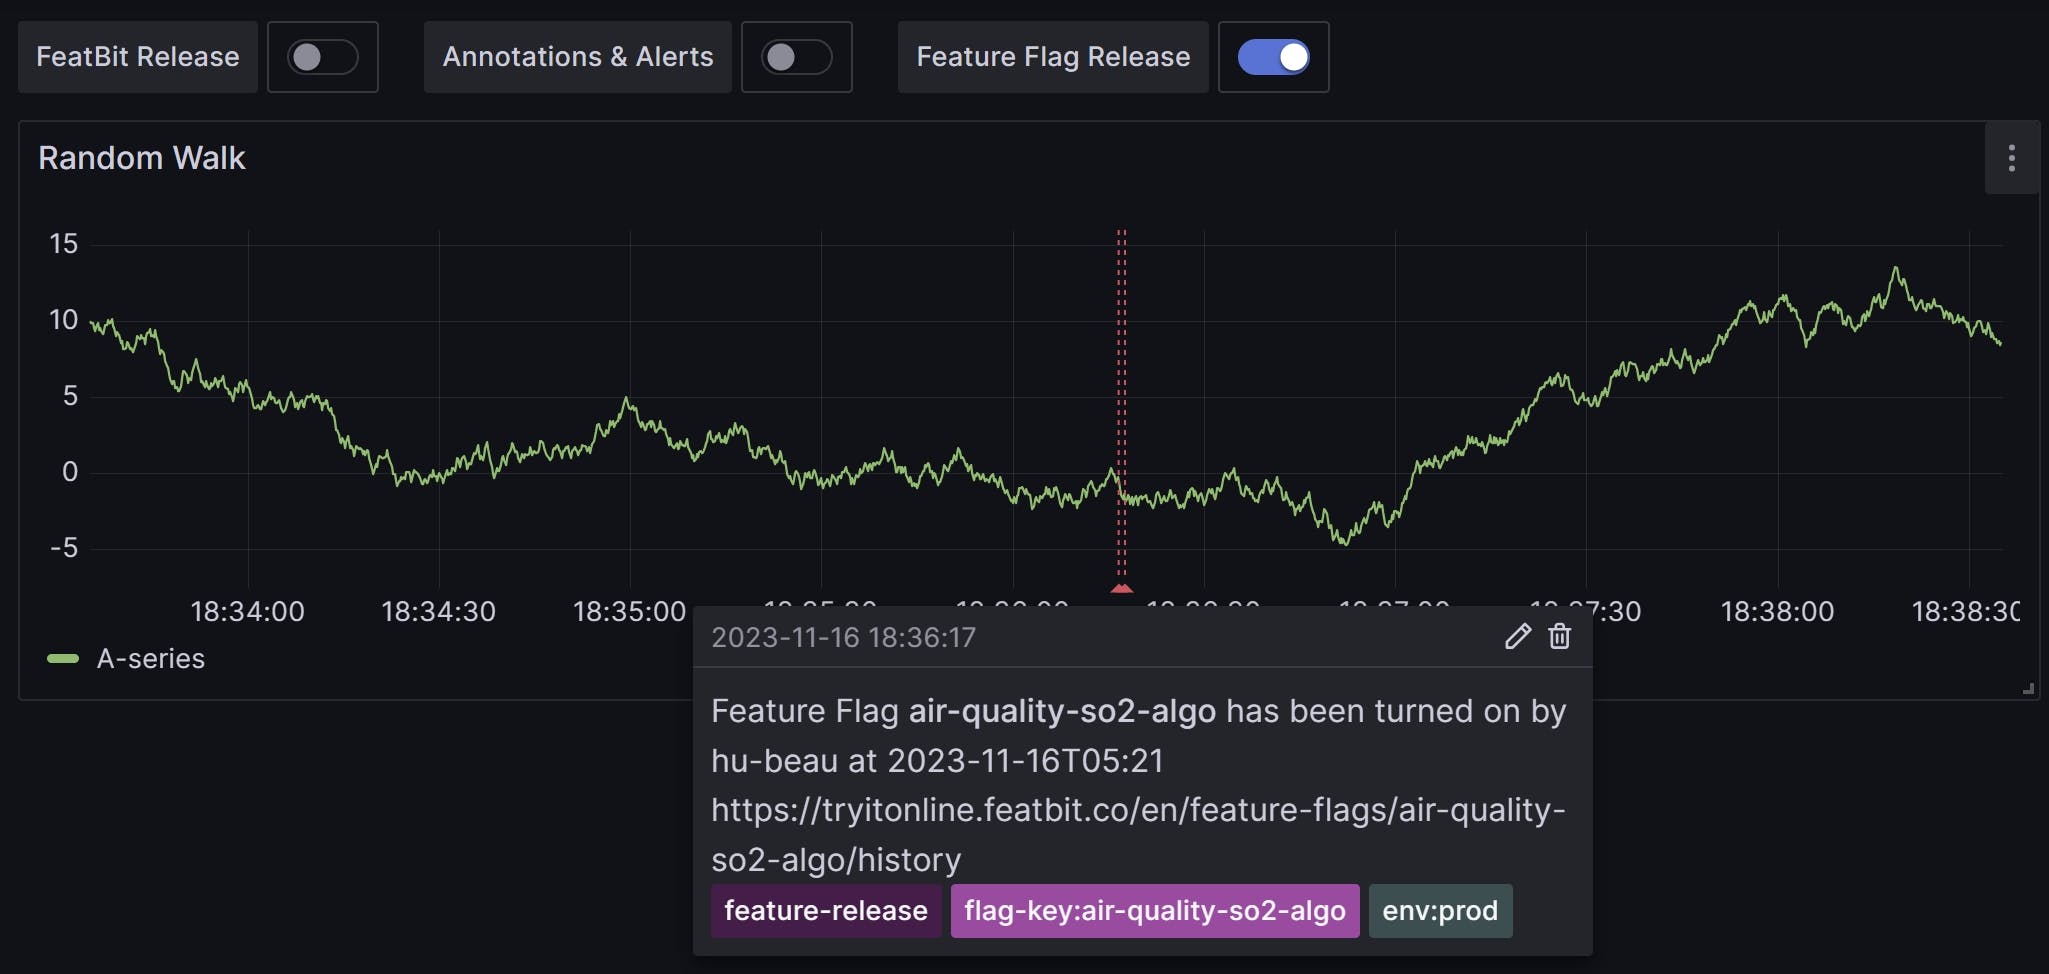
You can utilize FeatBit's Webhook integration to transmit updates about flags, environments, and projects to Grafana. These updates will appear as annotations, adding contextual information to your graphs. The figure below is an example:
Create Service Accounts for Integration
To use the Grafana integration, you need to create a Grafana service account and generate a service account token:
- In Grafana, open the Administration menu and select "Service accounts." The "Service accounts" tab appears.
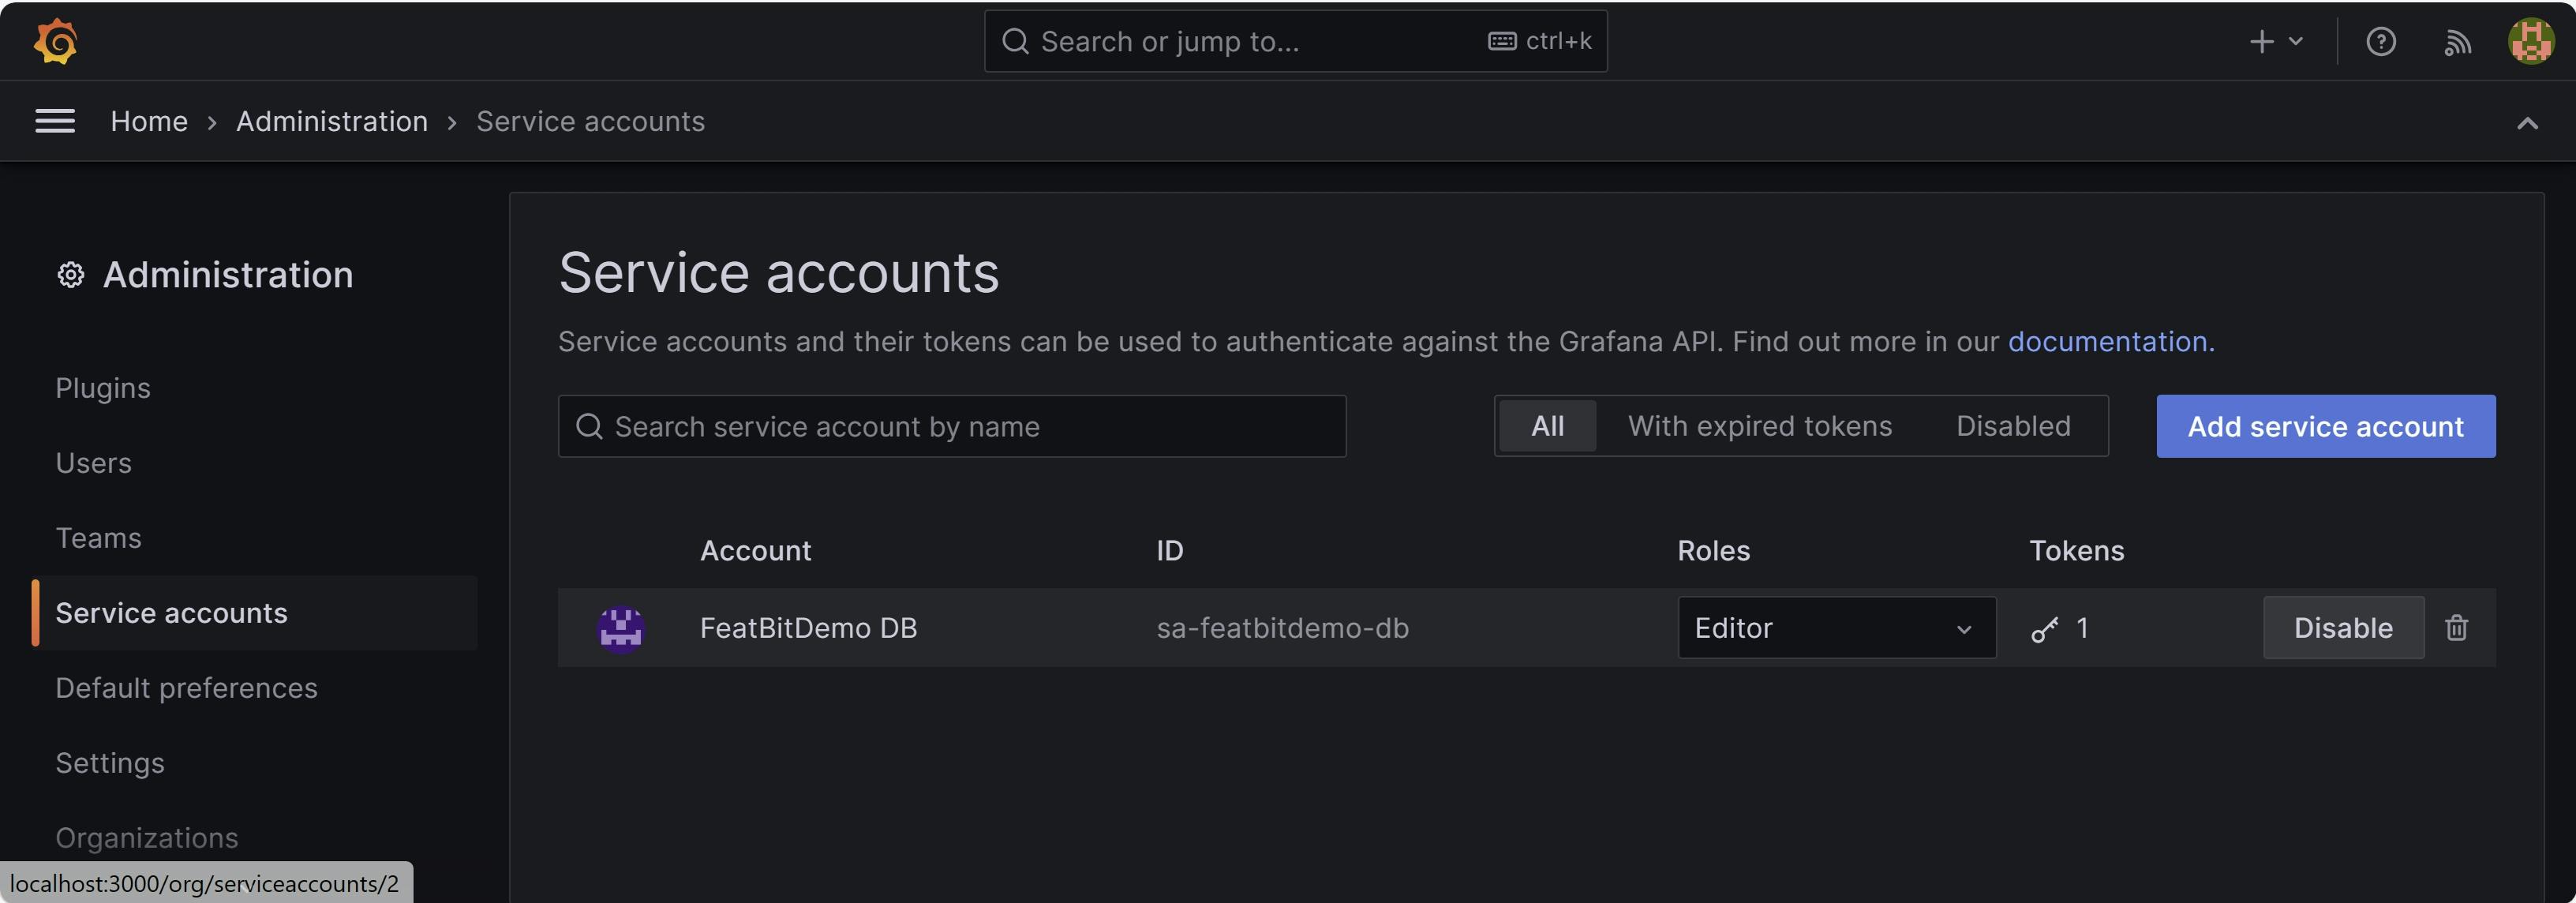
- Click Add service account. The "Create service account" page appears.
- Enter a Display name.
- Change the Role selection to "Editor"
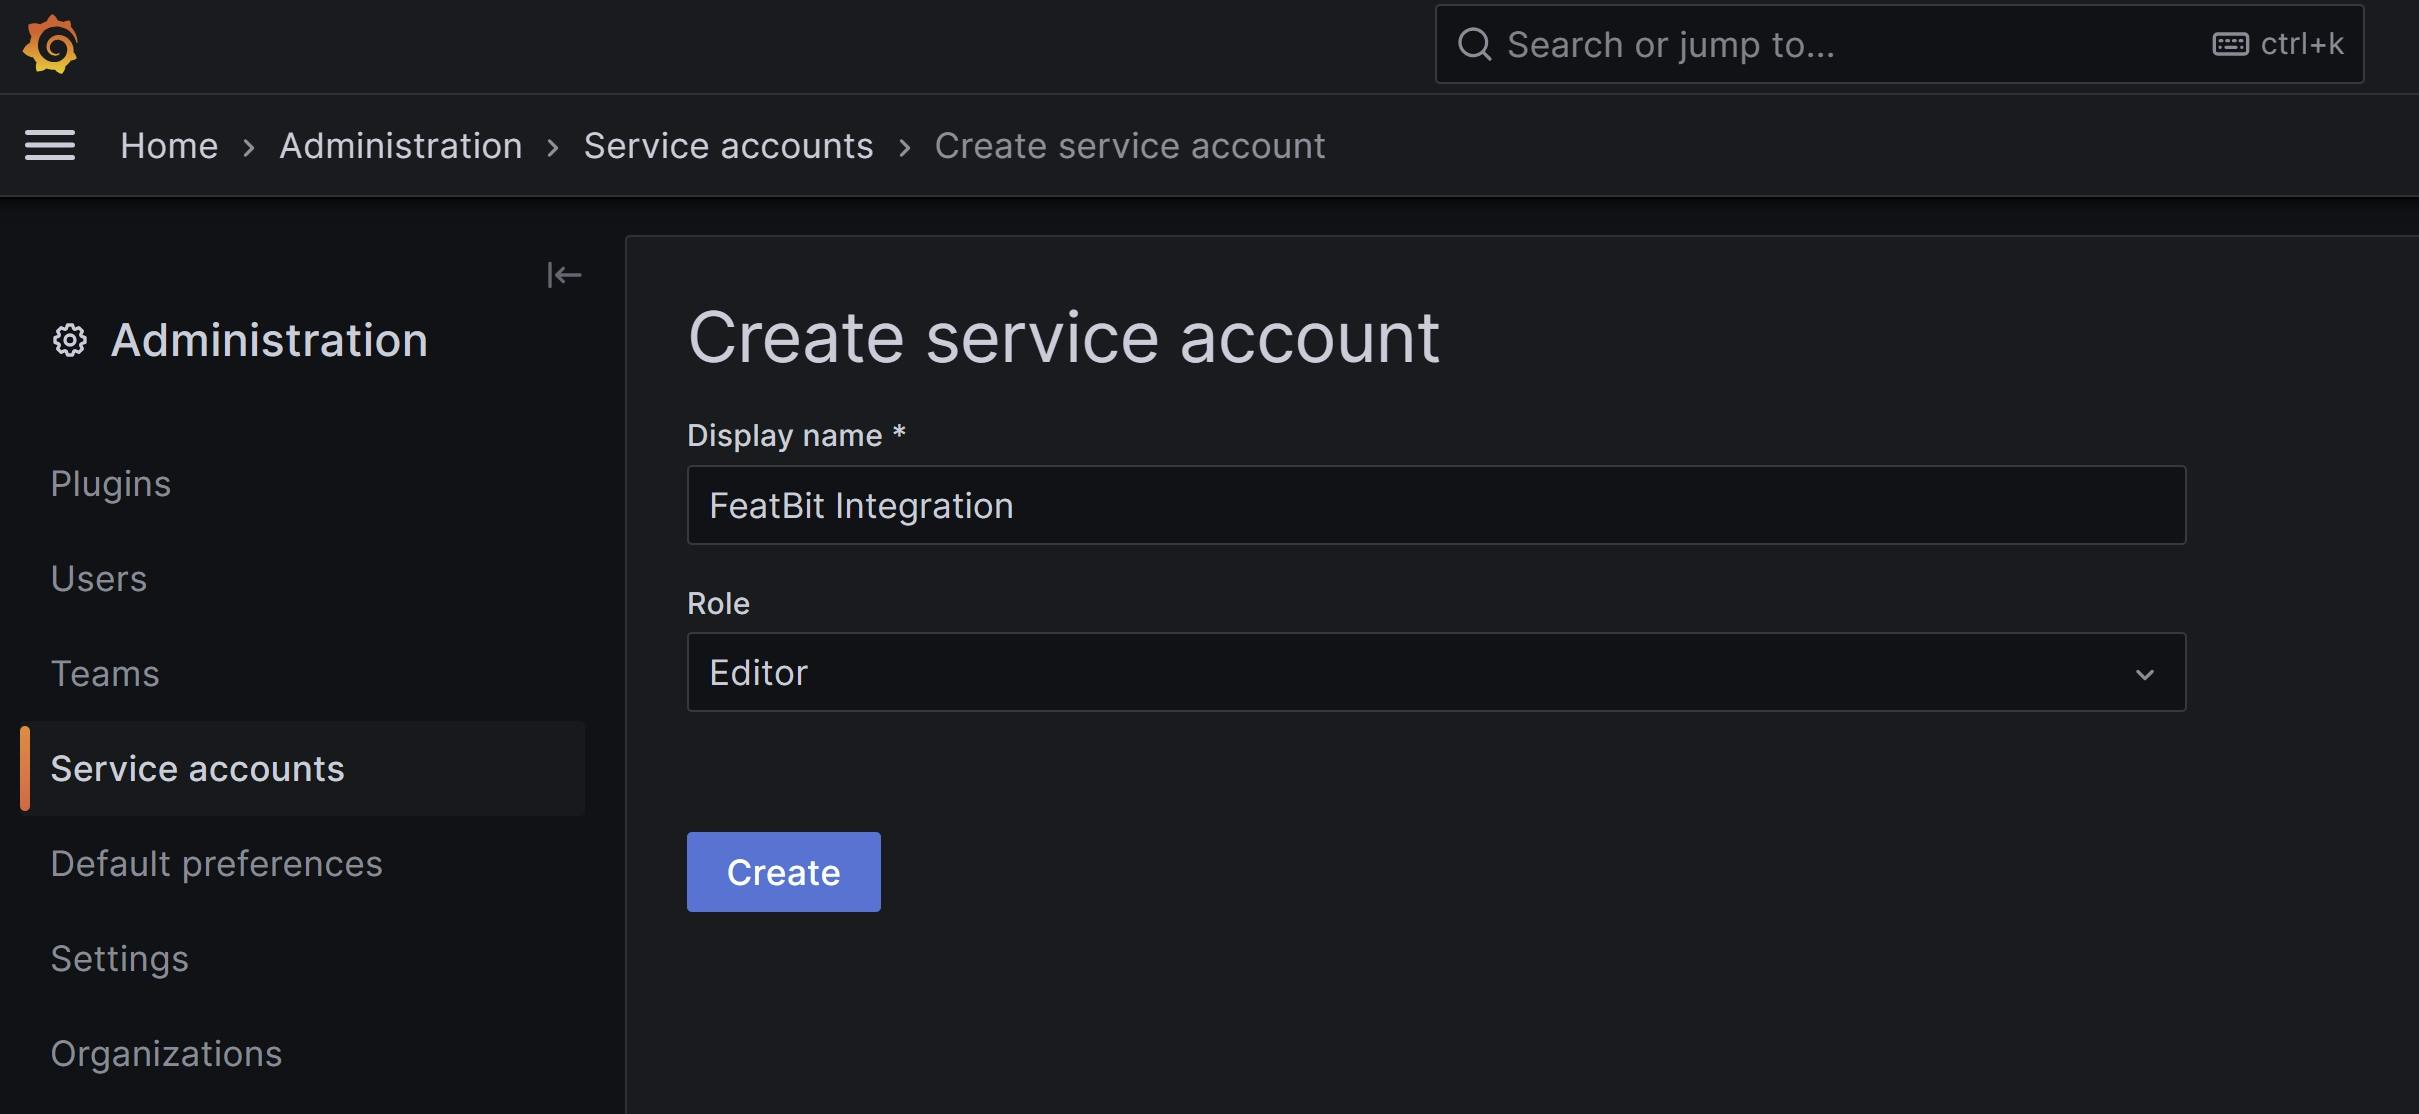
- Click Create. The "Service token" page appears.
- Click Add service account token.
- Enter a Display name for the token.
- Click Generate token.
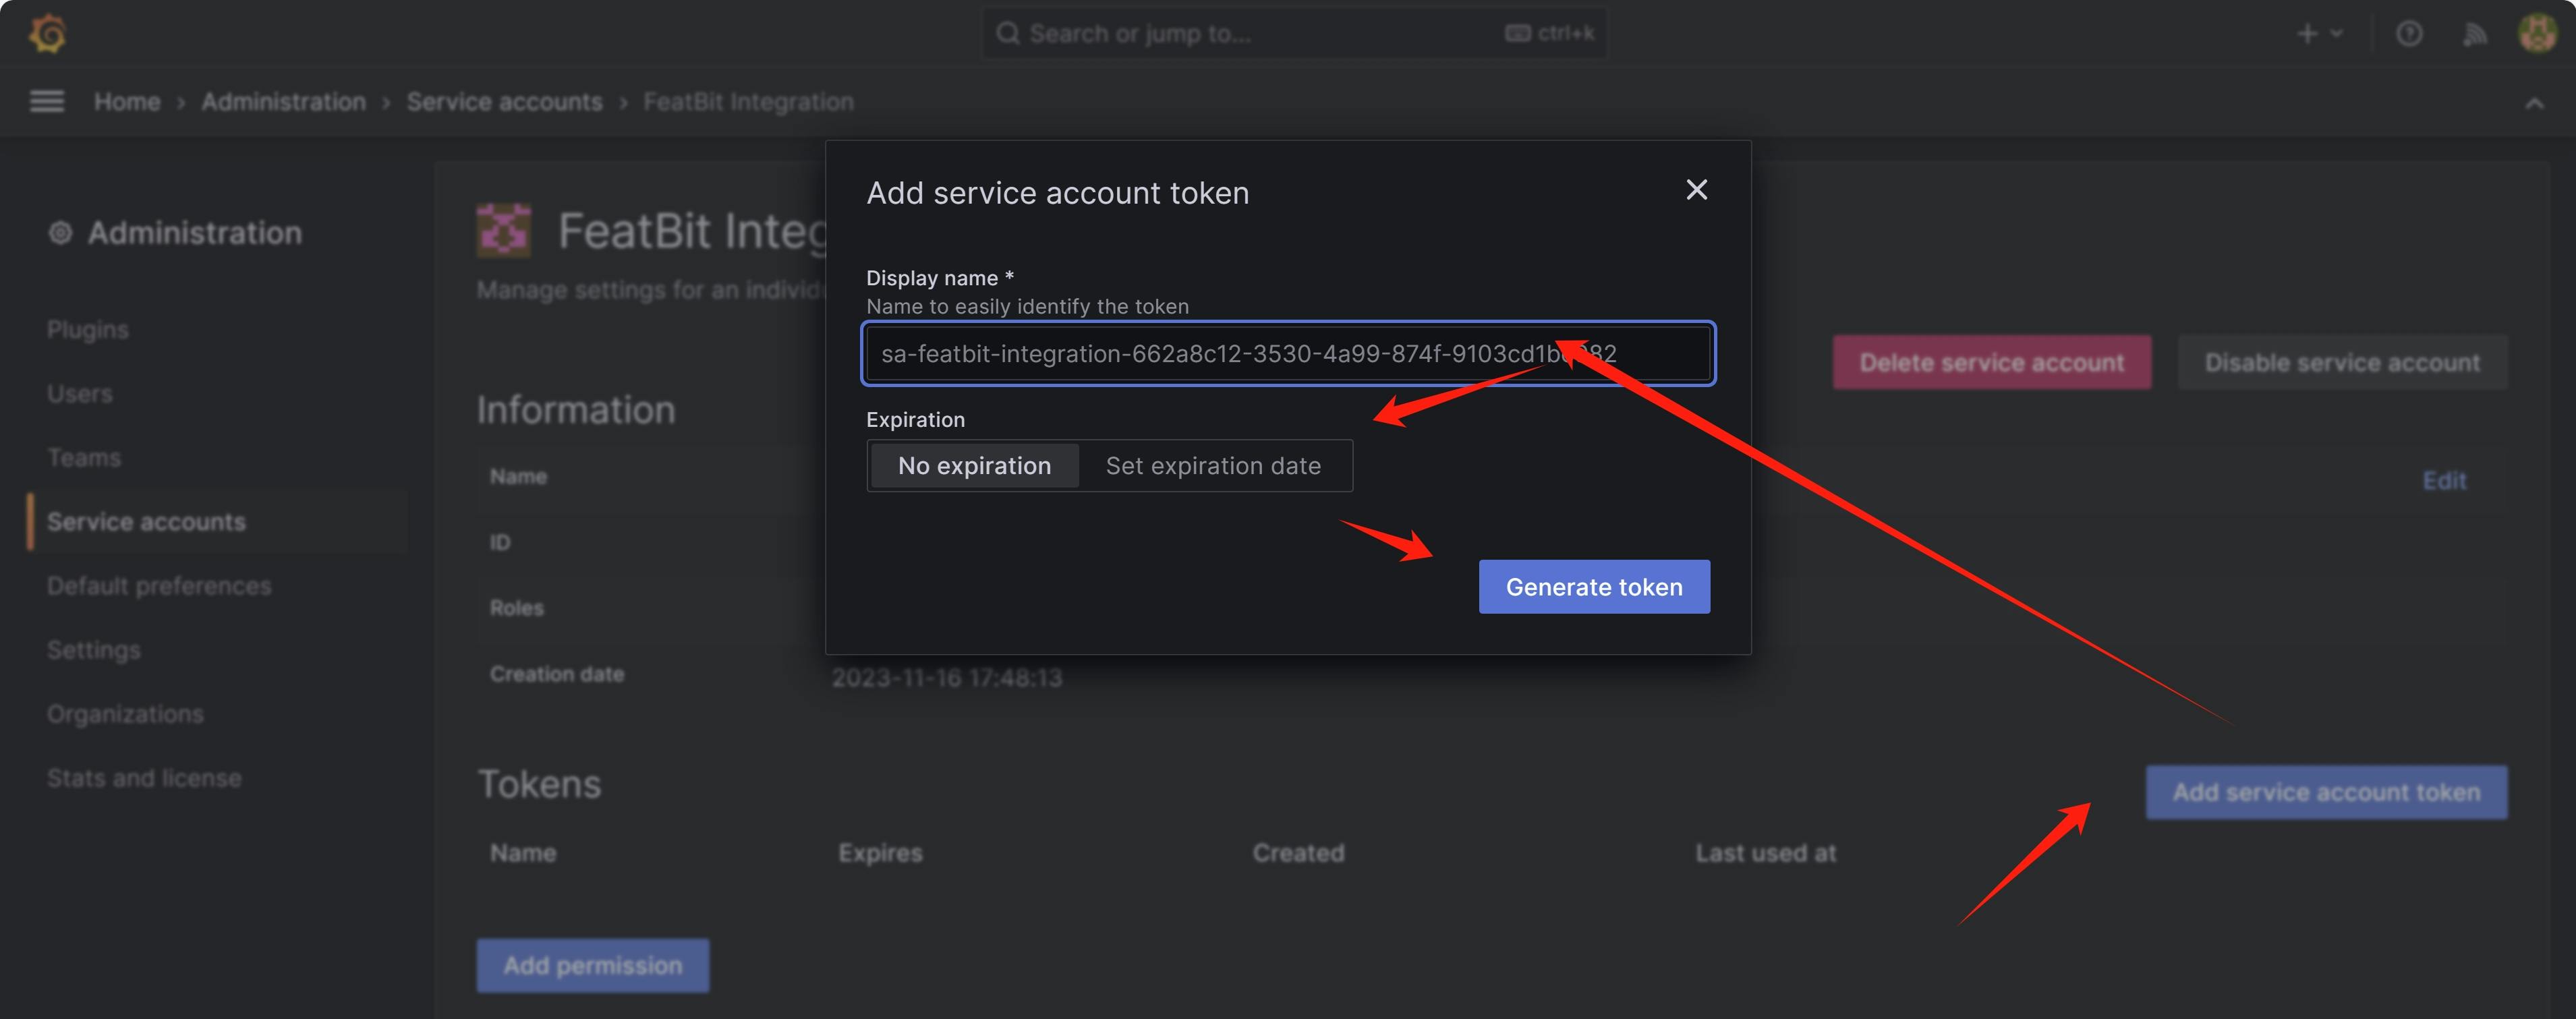
- Copy the token and save if somewhere secure. Grafana displays this token only once, so you must copy and store it now. You will use it to set up the Grafana integration in FeatBit.
Setting up WebHook for Grafana integration
You can use FeatBit's Webhook to subscribe to changes in Feature Flags, then create an event sender for Grafana.
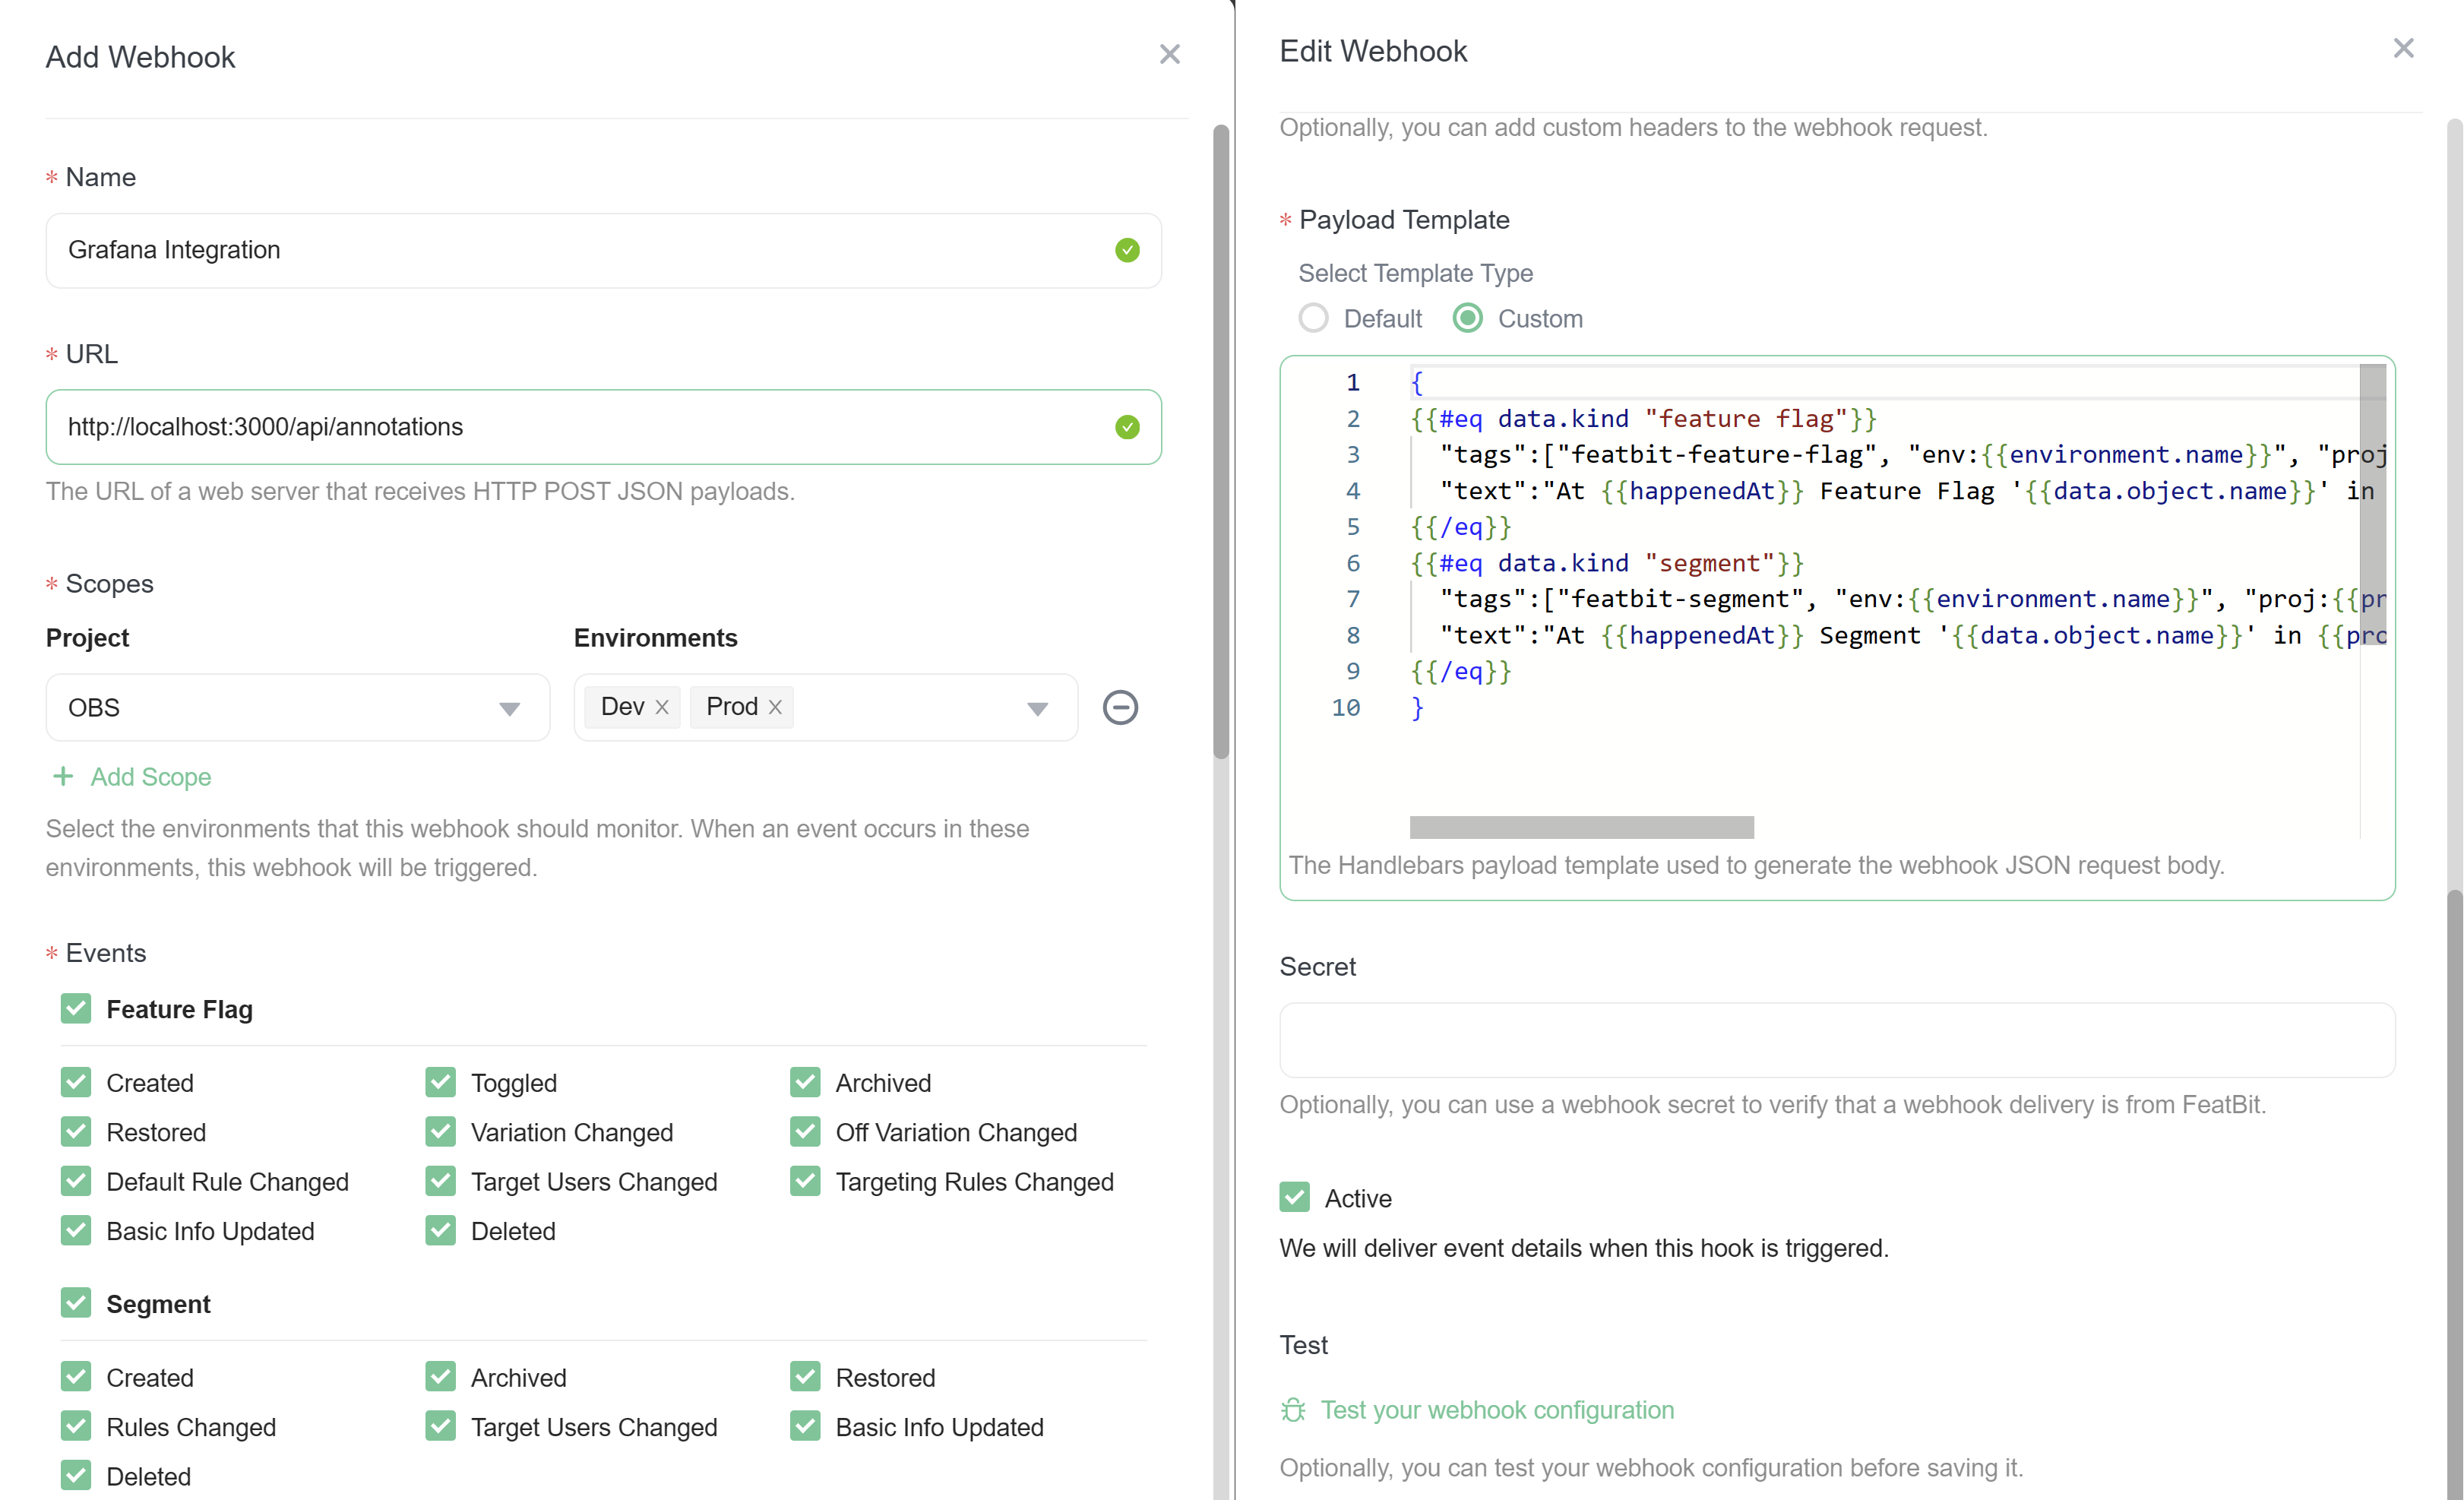
- On the menu, under Integrations, select Webhook to access the webhook configuration page.
- Click the + Add button.
- In the 'Add Webhook' drawer, enter the Name for the webhook.
- Enter the URL of the Grafana Annotation API. You can find the API URL in the official tutorial (opens in a new tab).
- Select the scope of WebHook you wish to subscribe to by choosing the Project and Environments.
- Choose the Events you want to subscribe to. For this tutorial, select Flag Change and Segment.
- Add the header Authorization for authorization. It uses bearer token for authorization. The token is the service account token you generated in the previous section.
- In the Payload Template enter the following template (you can also customize your own payload template):
{
{{#eq data.kind "feature flag"}}
  "tags":["featbit-feature-flag", "env:{{environment.name}}", "proj:{{project.name}}"],
  "text":"At {{happenedAt}} Feature Flag '{{data.object.name}}' in {{project.name}}/{{environment.name}}: <br/> {{#each changes}}{{this}}{{#unless @last}} ; {{/unless}}{{/each}}"
{{/eq}}
{{#eq data.kind "segment"}}
  "tags":["featbit-segment", "env:{{environment.name}}", "proj:{{project.name}}"],
  "text":"At {{happenedAt}} Segment '{{data.object.name}}' in {{project.name}}/{{environment.name}}: <br/> {{#each changes}}{{this}}{{#unless @last}} ; {{/unless}}{{/each}}"
{{/eq}}
}
For more information about WebHook, please refer this tutorial.
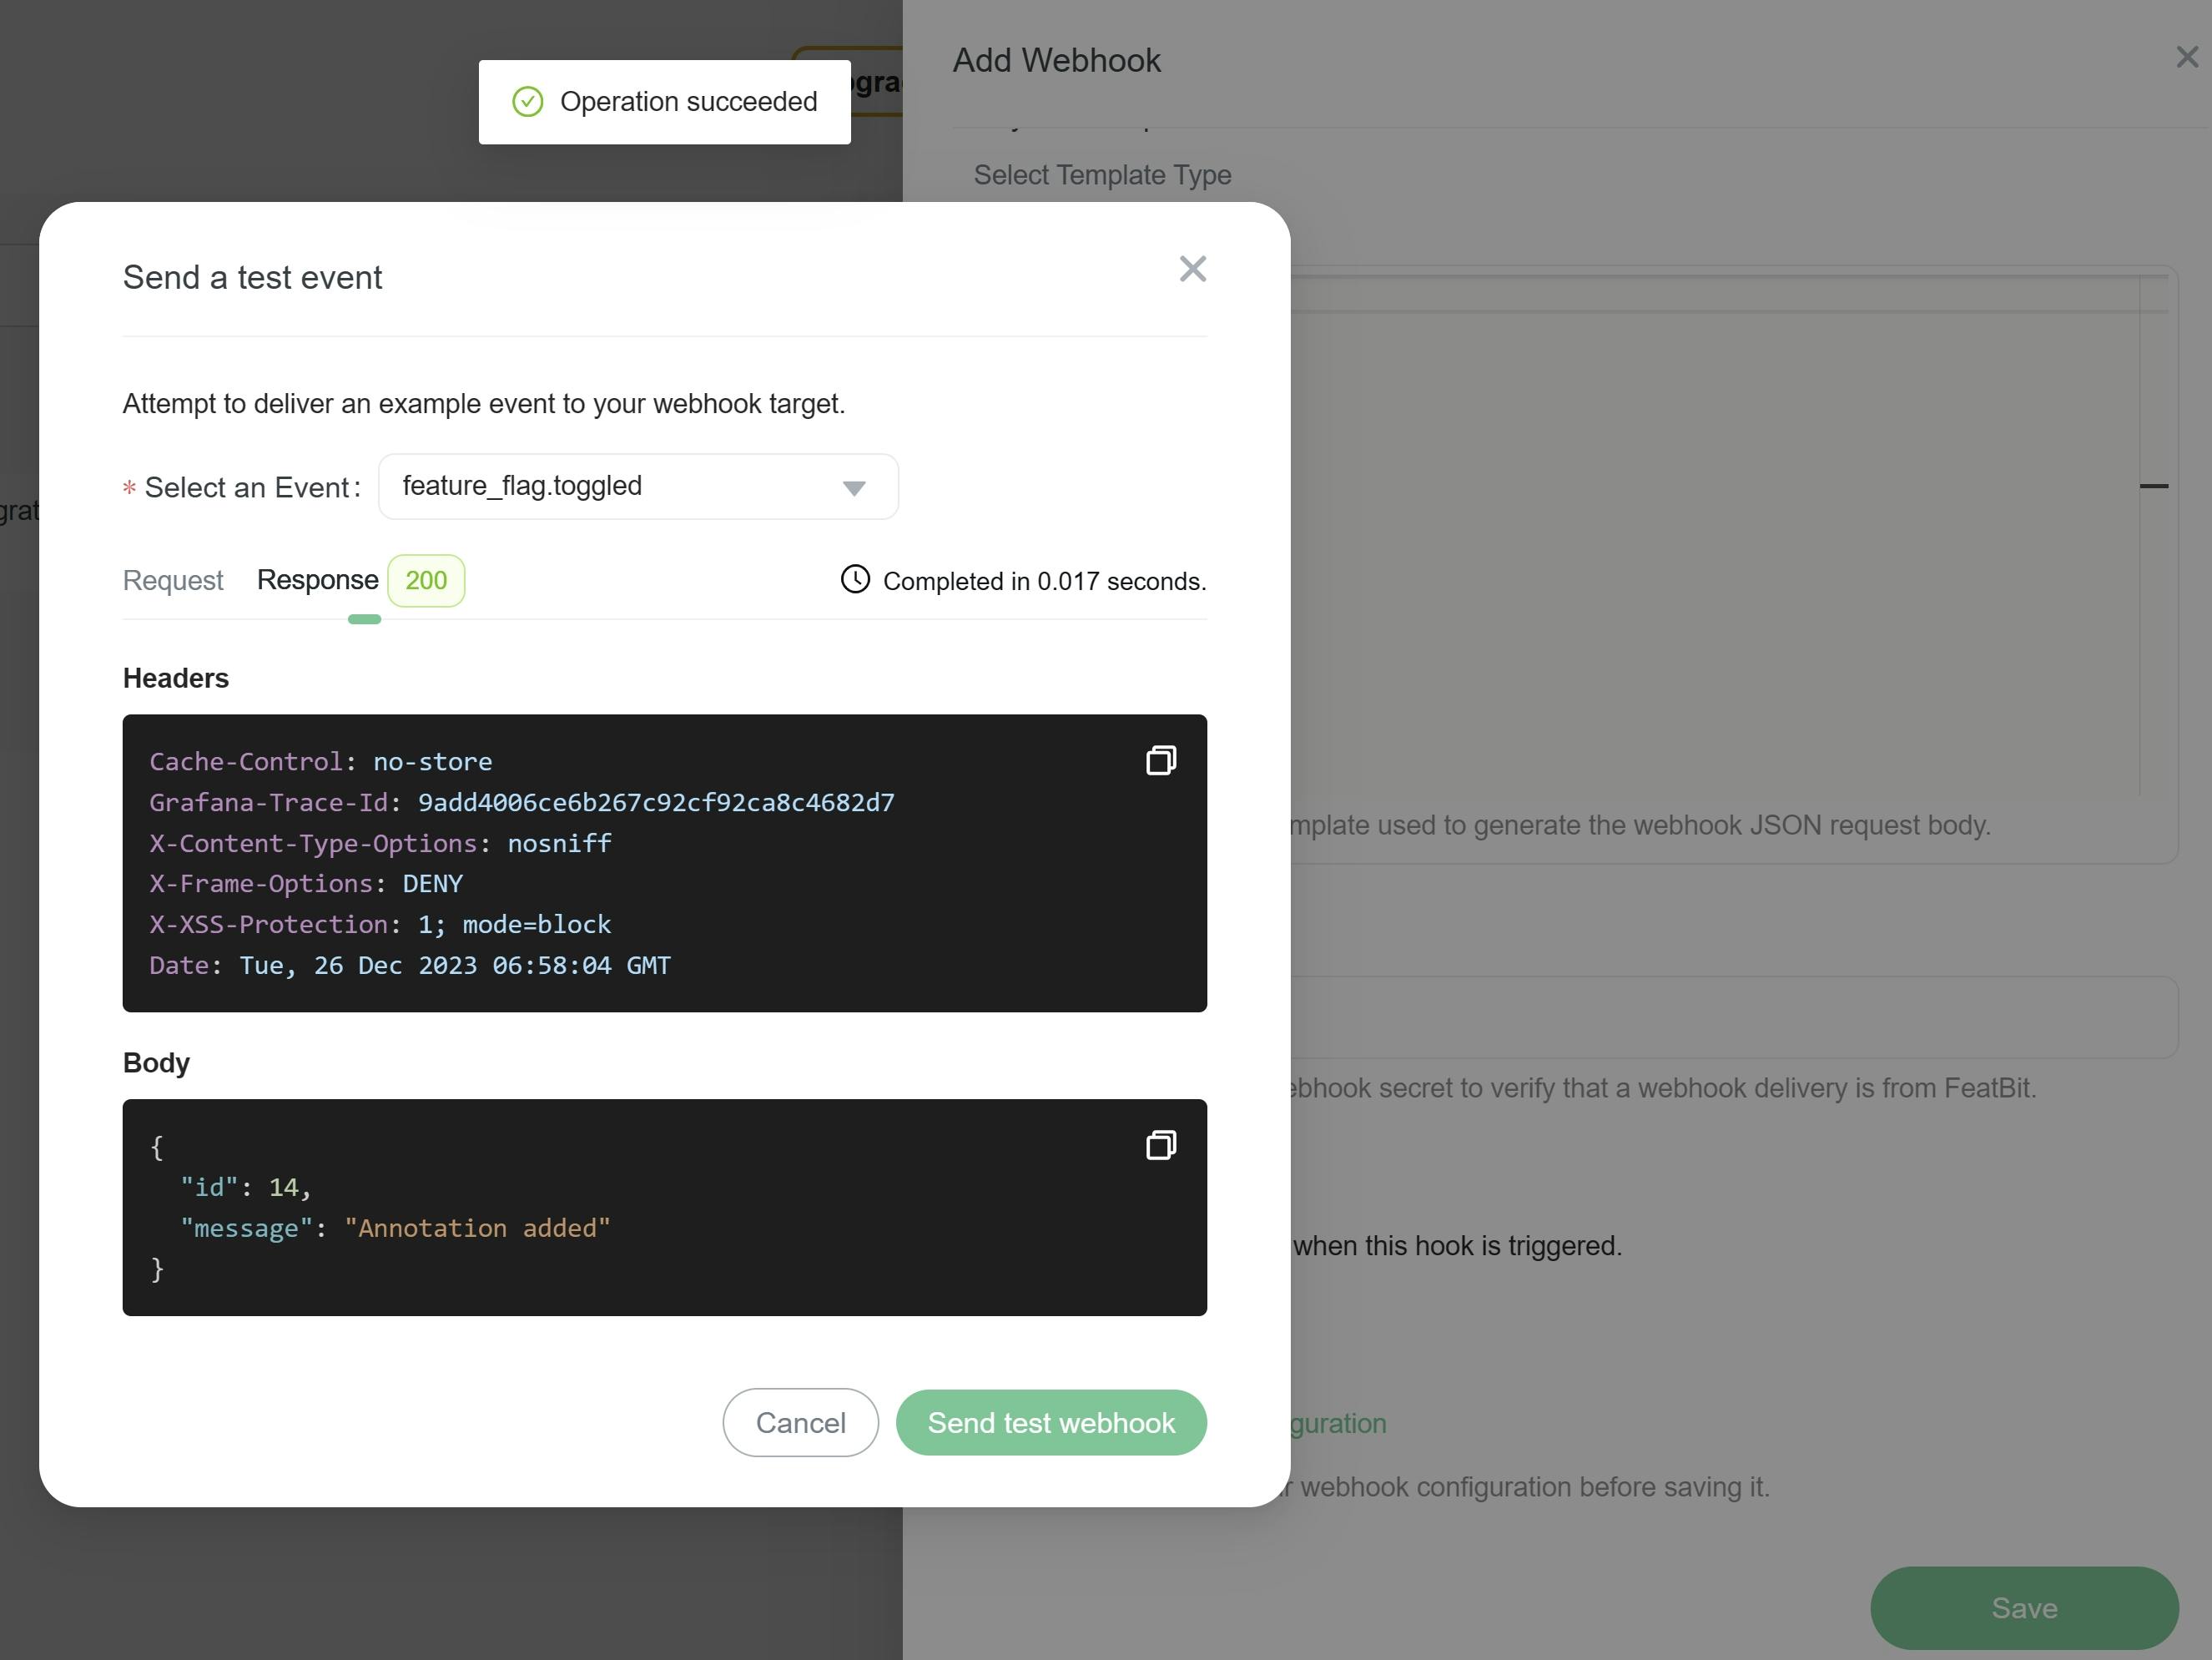
- Test your webhook configuration by clicking on the Test your webhook configuration link. If the test is successful, you will see a success message. If the test fails, you will see an error message.
- You will see the webhook you created in the webhook list.
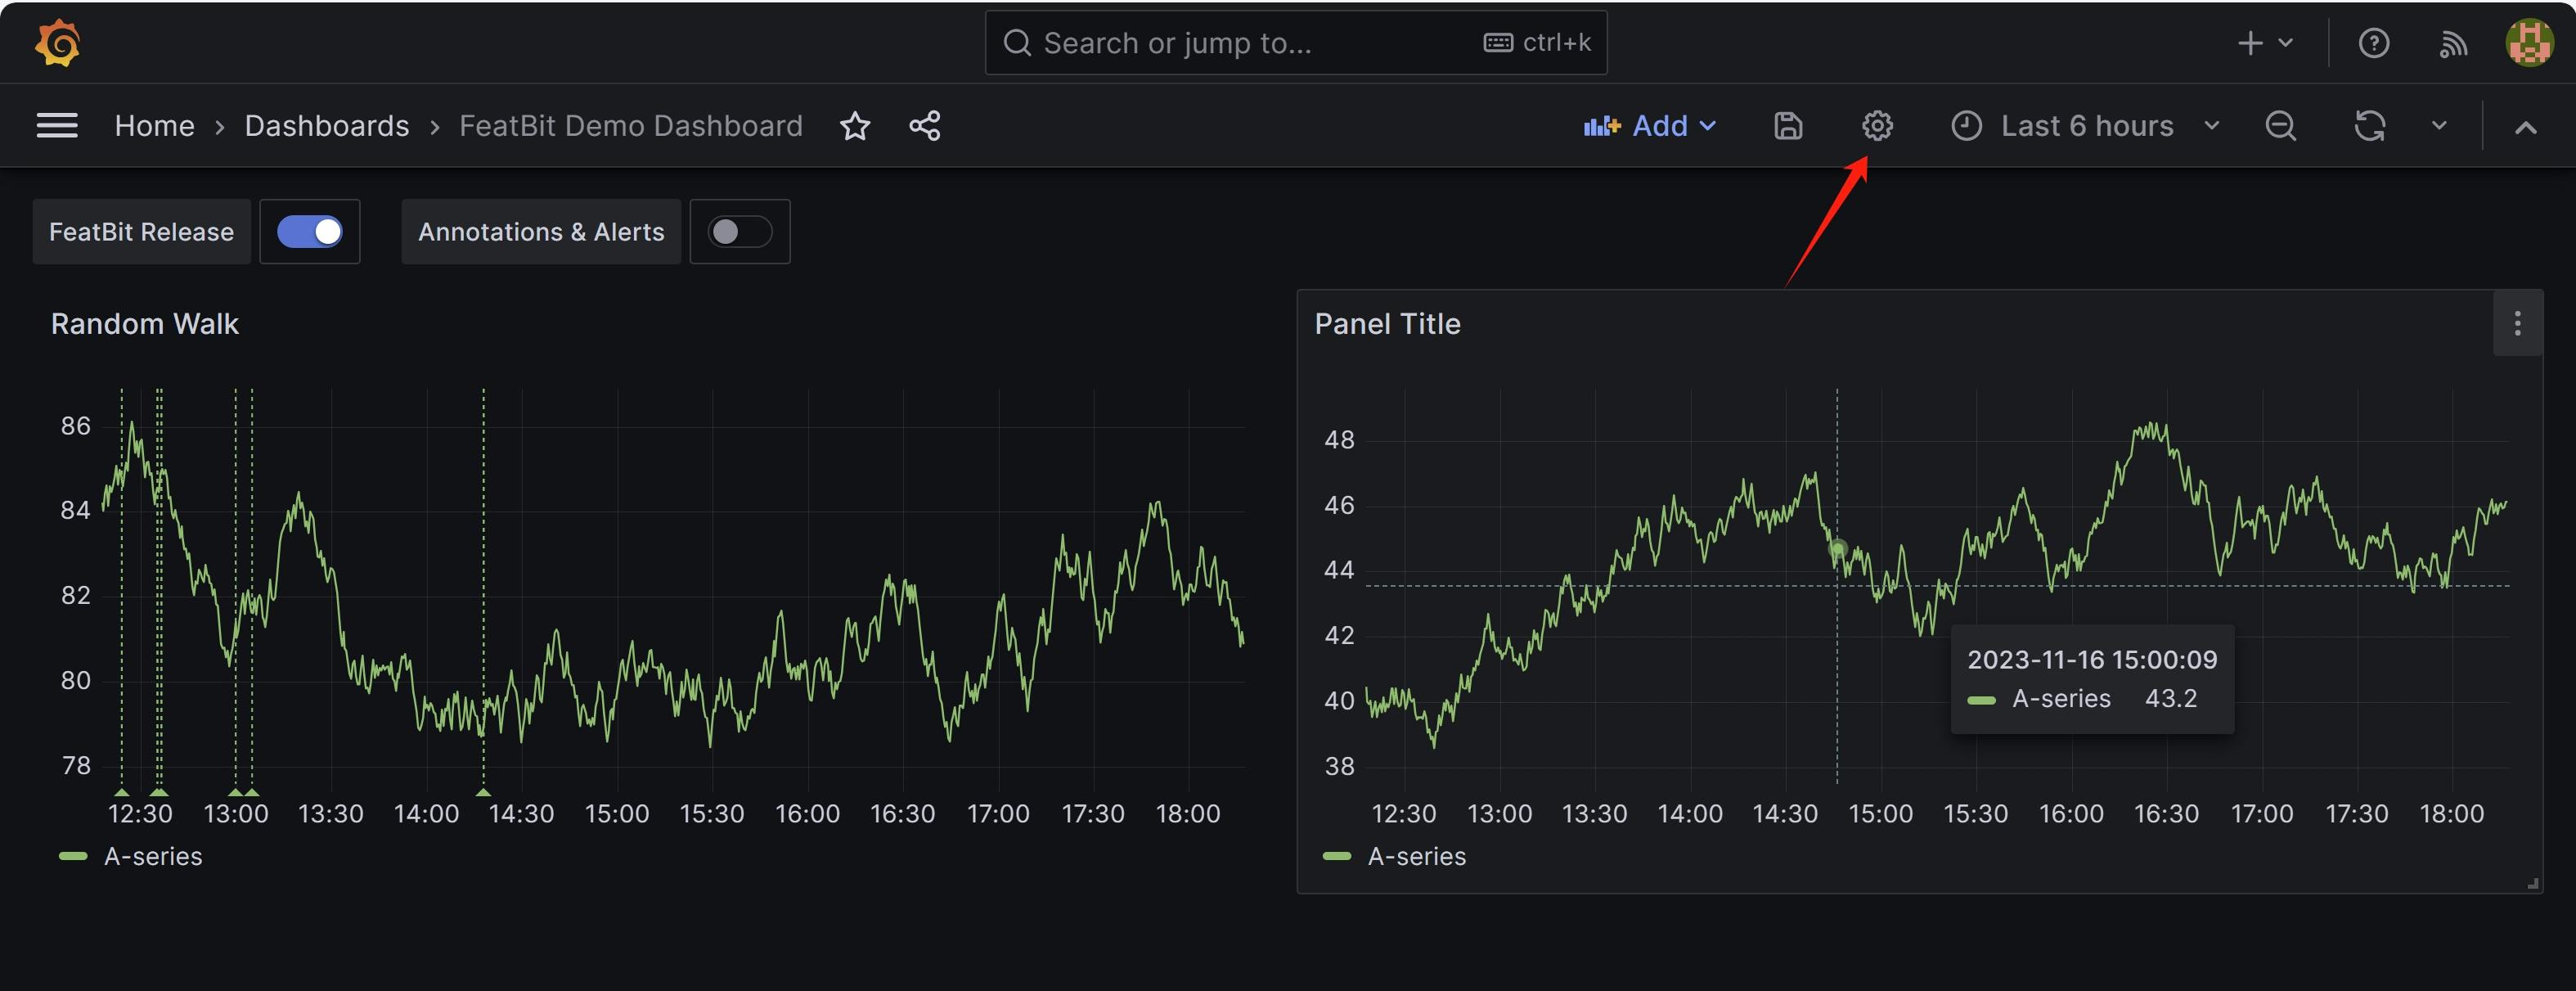
Adding FeatBit annotations to Grafana dashboards
To add FeatBit Webhook events as annotations in Grafana dashboards:
- Open the Grafana dashboard in edit mode.
- Click the Dashboard settings gear icon button located at the top of the page.
- Click Annotations.
- Click New query. The "New annotation" page appears.
- Enter a human-readable name for the annotation, such as "FeatBit feature flags."
- In the Data source menu, select "-- Grafana --."
- In the Filter by menu, select "Tags."
- In the Tag field, enter tag(s) that you specified in the webhook. These are tags that you used to filter the annotations that appear on your dashboard.
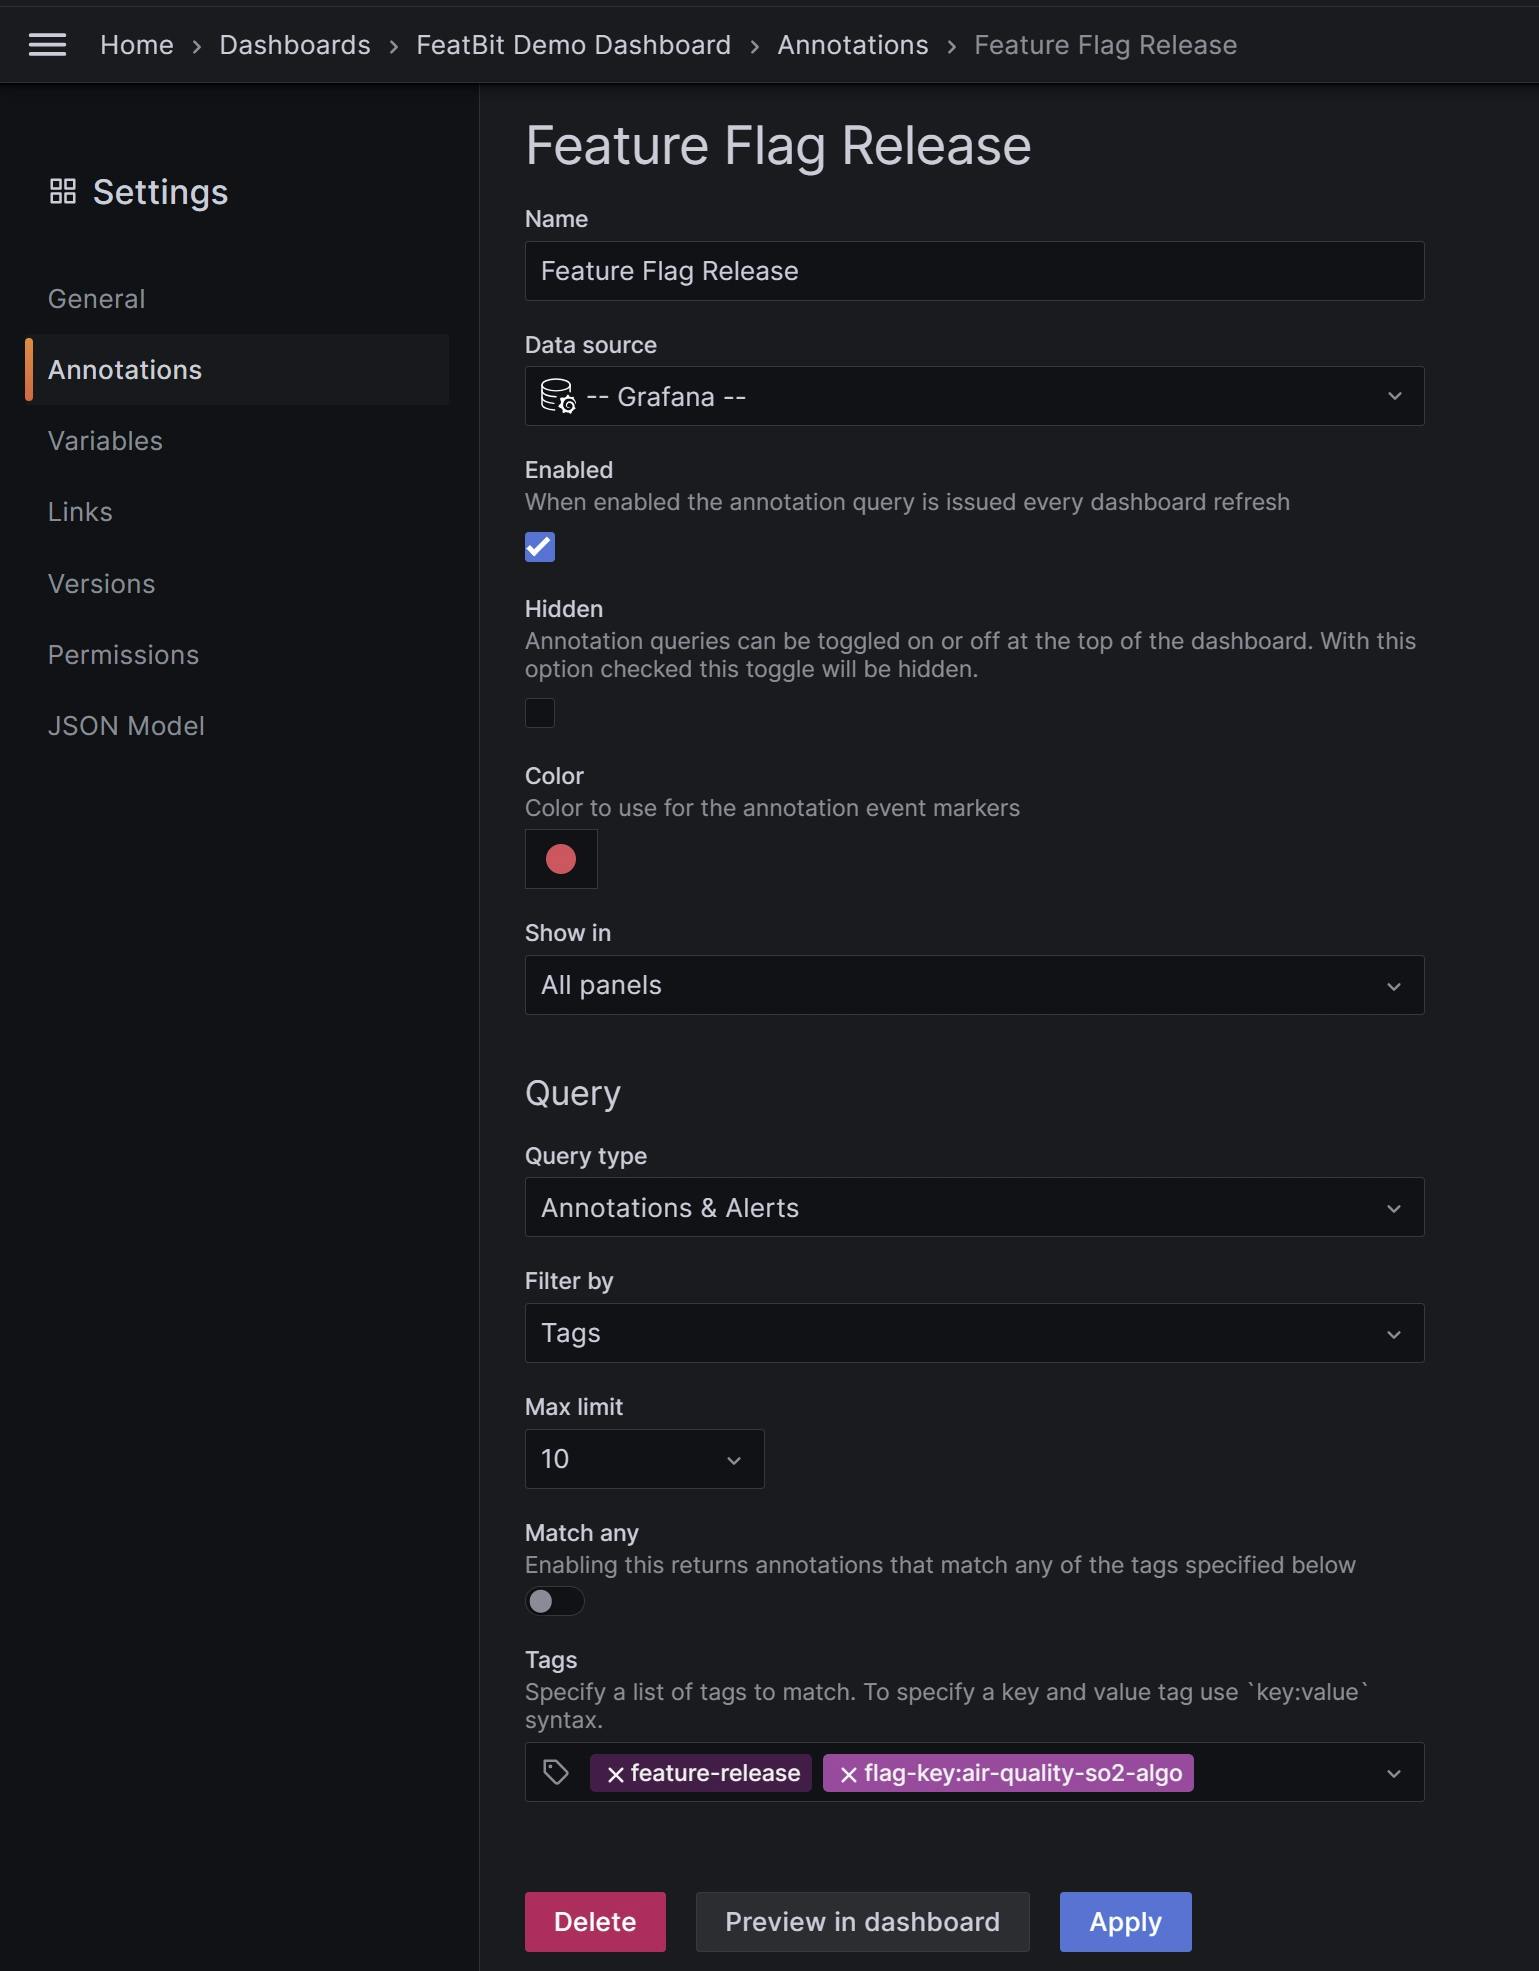
- Click Save Dashboard. Then, return to the Dashboard, and you will see the annotations appear on the graph.
You can disable the annotations by clicking the toggle at the top of the dashboard.